
 Download PDF
 Download PDF
Market Overview
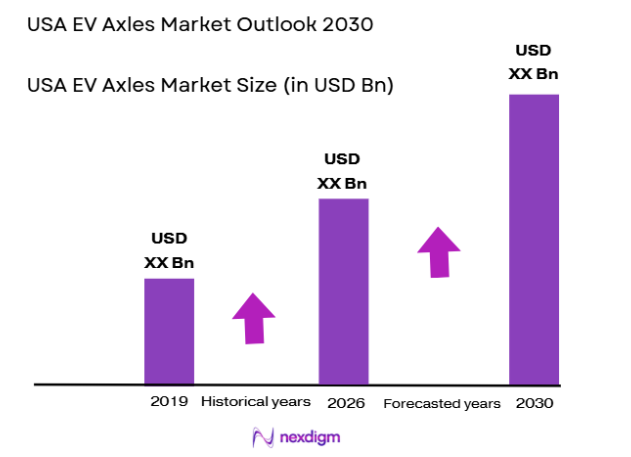
The USA Electric Vehicle (EV) Axles market is expected to experience significant growth in the coming years, driven by the increasing demand for electric vehicles. In 2023, the market size was valued at approximately USD ~billion, and it is projected to reach USD ~ billion by 2024. The growth is largely attributed to government incentives, rising consumer awareness of environmental sustainability, and the global shift towards reducing carbon emissions. Furthermore, advancements in axle technologies, including lightweight materials and enhanced powertrains, are accelerating the adoption of EVs, boosting the demand for EV-specific axles.
The USA, particularly regions like California, Michigan, and Texas, dominate the EV axles market due to their strong automotive industries and substantial EV manufacturing presence. California leads with its ambitious zero-emission vehicle goals and heavy investments in EV infrastructure. Michigan, known as the “Motor City,” remains a key hub for automotive innovation, housing major EV manufacturers like General Motors and Ford. Texas follows with its expanding electric truck manufacturing initiatives, driven by both local and international EV producers. These regions have become critical centers of innovation and production for EVs and their components, including axles.
Market Segmentation
By Axle Type
The USA EV Axles market is segmented by axle type into Drive Axles, Non-Drive Axles, Independent Axles, and Dependent Axles. Among these, Drive Axles hold a dominant share in the market, driven by their essential role in the overall performance of electric vehicles. These axles, which transfer power from the electric motor to the wheels, are crucial for both passenger electric vehicles (EVs) and commercial EVs, especially those in the heavy-duty segment. The rise in electric trucks and the demand for higher torque capacities in commercial vehicles contribute significantly to the dominance of drive axles.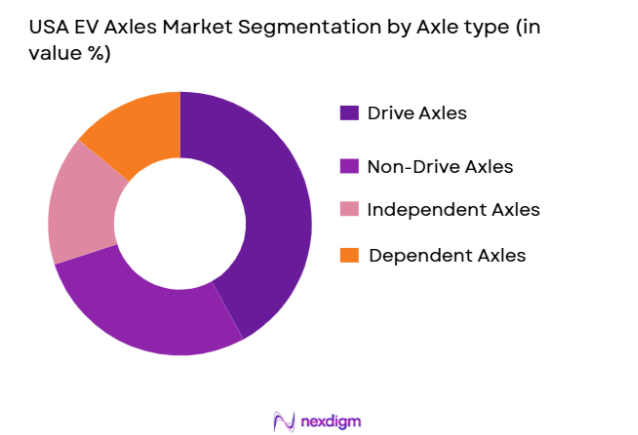
By Vehicle Type
The USA EV Axles market is also segmented by vehicle type into Battery Electric Vehicles (BEVs), Plug-in Hybrid Electric Vehicles (PHEVs), and Hybrid Electric Vehicles (HEVs). The Battery Electric Vehicles (BEVs) segment is leading the market due to the rising demand for fully electric vehicles that are powered solely by electric batteries. These vehicles require specialized electric axles capable of handling higher power and torque. Furthermore, the increasing consumer shift towards sustainable transportation and government initiatives promoting BEVs further contribute to the growth of this segment.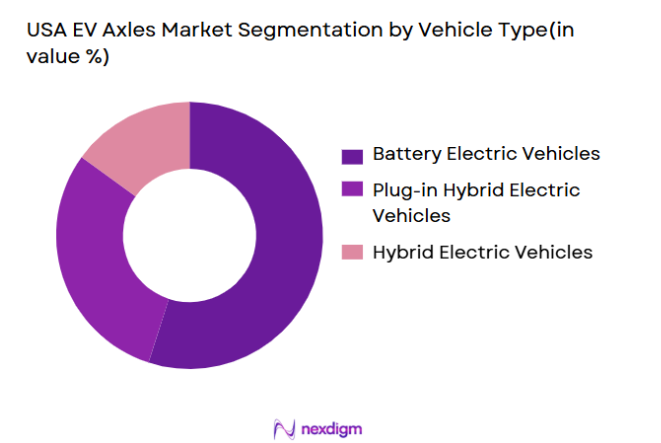
Competitive Landscape
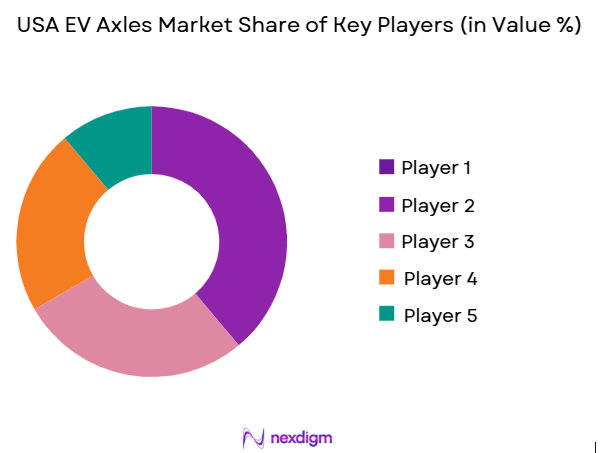
The USA EV axles market is becoming increasingly competitive, with a few dominant players driving innovation and growth. Key players include Tesla, General Motors, Ford, Dana Incorporated, and ZF Friedrichshafen AG. These companies have made significant investments in electric mobility, and their strong presence in the electric vehicle market further solidifies their position in the EV axles segment. Tesla and General Motors are particularly influential, given their pioneering role in the EV space and the substantial demand for their electric vehicles. Other companies like Dana and ZF specialize in providing advanced axle systems tailored to the specific needs of electric vehicles, including high torque capacities and lightweight materials.
| Company | Establishment Year | Headquarters | Technology Focus | Market Position | R&D Investment | Manufacturing Capacity |
| Tesla | 2003 | Palo Alto, CA | ~ | ~ | ~ | ~ |
| General Motors (GM) | 1908 | Detroit, MI | ~ | ~ | ~ | ~ |
| Ford Motor Company | 1903 | Dearborn, MI | ~ | ~ | ~ | ~ |
| Dana Incorporated | 1904 | Maumee, OH | ~ | ~ | ~ | ~ |
| ZF Friedrichshafen AG | 1915 | Friedrichshafen, DE | ~ | ~ | ~ | ~ |
USA EV Axles Market Analysis
Growth Drivers
Urbanization
Urbanization in Indonesia continues to drive the need for air quality monitoring systems. In 2023, the urban population in Indonesia reached approximately ~% of the total population, up from ~% in 2019, according to World Bank data. The rapid urbanization results in increased vehicular emissions, industrial activities, and construction, leading to poorer air quality in major cities. The rising urban population is pushing for more air quality monitoring systems to combat pollution and ensure the health and safety of urban dwellers. The government has ramped up efforts to monitor urban air quality as urban growth accelerates.
Industrialization
Indonesia’s industrialization has contributed to the deteriorating air quality, particularly in regions like Java and Sumatra. According to data from the International Labour Organization (ILO), Indonesia’s industrial sector saw significant growth in the past decade, with manufacturing representing ~% of the GDP in 2022. This industrial expansion is linked to higher emissions from factories, power plants, and transport logistics. In response to this challenge, Indonesia has initiated various environmental policies aimed at reducing industrial emissions, underscoring the increasing demand for air quality monitoring systems to track pollution levels.
Restraints
High Initial Costs
High initial costs associated with the installation of air quality monitoring systems remain a significant barrier in Indonesia. As reported by the Indonesian Ministry of Environment and Forestry in 2022, the upfront investment for establishing a comprehensive air quality monitoring network, including the cost of sensors and maintenance, is estimated at USD ~million for a large city like Jakarta. This high capital expenditure limits the ability of smaller municipalities and private sector players to implement air quality monitoring systems on a wider scale.
Technical Challenges
Technical challenges in the deployment and operation of air quality monitoring systems continue to pose obstacles in Indonesia. According to a report by the Indonesian Meteorological, Climatological, and Geophysical Agency (BMKG), many monitoring systems currently in operation suffer from issues like calibration errors and inadequate data resolution. In rural areas, technical difficulties related to maintaining equipment, inconsistent power supply, and lack of local expertise further hinder the accurate tracking of air quality. These issues are particularly prevalent in areas where technological infrastructure is less developed.
Opportunities
Technological Advancements
Advancements in air quality monitoring technology present significant opportunities for growth in Indonesia’s market. In 2023, the introduction of IoT-based air monitoring systems allowed real-time data transmission, increasing efficiency and the accessibility of air quality data. These systems, which include lower-cost sensors and cloud computing solutions, enable quicker detection of pollution and more accurate forecasting of air quality trends. The Indonesian government and private companies are increasingly adopting such technologies, driven by the need for smarter urban environments and better public health outcomes.
International Collaborations
International collaborations between Indonesia and global environmental agencies are also driving the air quality monitoring market. Indonesia’s partnerships with the United Nations Environment Programme (UNEP) and the World Health Organization (WHO) are focusing on enhancing air quality monitoring in regions with high pollution levels. In 2022, these collaborations led to the establishment of 20 new air quality monitoring stations in cities like Surabaya and Medan, aiming to improve the overall pollution tracking infrastructure. These initiatives open up further opportunities for market expansion and international investment in the sector.
Future Outlook
Over the next few years, the USA EV axles market is expected to see robust growth, primarily driven by the continuous rise in electric vehicle adoption, advancements in axle technology, and increasing consumer demand for sustainable transport solutions. With supportive government policies, infrastructure developments, and investments from both OEMs and suppliers, the market is positioned for strong expansion. Additionally, the increasing shift towards commercial EVs, including electric trucks and buses, will further propel the demand for high-performance electric axles.
Major Players in the Market
- Tesla Inc.
- General Motors (GM)
- Ford Motor Company
- Dana Incorporated
- ZF Friedrichshafen AG
- Bosch Group
- GKN Automotive
- Magna International Inc.
- Schaeffler Group
- ABB Ltd.
- Continental AG
- Valeo SA
- Aisin Seiki Co., Ltd.
- Hyundai Mobis
- JTEKT Corporation
Key Target Audience
- Automobile Manufacturers
- Electric Vehicle OEMs
- Component Suppliers (Axles, Powertrains, etc.)
- Investments and Venture Capitalist Firms
- Government and Regulatory Bodies (e.g., U.S. Department of Energy, U.S. Environmental Protection Agency)
- Automotive Industry Analysts
- Fleet Operators (Electric Buses, Trucks)
- EV Infrastructure Providers
Research Methodology
Step 1: Identification of Key Variables
The research process begins by identifying key variables influencing the USA EV axles market. This involves constructing an ecosystem map of all major stakeholders, including manufacturers, suppliers, and OEMs, supported by secondary data sources. The objective is to outline critical market drivers, challenges, and growth factors.
Step 2: Market Analysis and Construction
In this phase, historical market data is analyzed, including EV penetration rates, axle demand patterns, and EV market growth trends. This analysis helps in assessing the future outlook and defining key market drivers that will influence the EV axle sector.
Step 3: Hypothesis Validation and Expert Consultation
Market hypotheses are validated through consultations with industry experts, including key players in the EV axle manufacturing space. This step helps refine the data, ensuring it aligns with current industry trends and challenges. Interviews with OEMs and suppliers provide valuable insights into the operational aspects of the market.
Step 4: Research Synthesis and Final Output
The final phase involves synthesizing all research findings into a comprehensive report. This includes validating the market segments, cross-referencing data with industry leaders, and providing insights into growth opportunities and emerging trends within the USA EV axles market.
- Executive Summary
- Research Methodology (Market Definitions and Assumptions, USA-Specific Terminologies, Abbreviations, Market Sizing Logic, Bottom-Up & Top-Down Validation, Triangulation Framework, Primary Interviews Across OEMs, Suppliers, Distributors, and EV Manufacturers, Demand-Side & Supply-Side Weightage, Data Reliability Index, Limitations & Forward-Looking Assumptions)
- Definition and Scope
- Market Genesis and Evolution Pathway
- USA EV Axles Industry Timeline
- Business Cycle of EV Axles in the USA
- USA EV Axles Supply Chain & Value Chain Analysis

- Key Growth Drivers
Adoption of EVs and Government Policies
Technological Advancements in Axle Systems
Increase in Electric Trucking
Growing Focus on Sustainability and Low-Carbon Footprint - Market Opportunities
Expansion of EV Manufacturing Plants in the USA
Development of Autonomous Electric Vehicles
Rise in Demand for Lightweight and Durable Axles - Key Trends
Electrification of Commercial and Heavy-Duty Vehicles
Integration of Axles with Electric Powertrains
Growth of Modular and Scalable Axles for EVs - Regulatory & Policy Landscape
USA Federal EV Policies and Incentives
Environmental Regulations for EV Manufacturing
Vehicle Safety and Durability Standards - SWOT Analysis
Technological Strengths of EV Axles
Weaknesses in Manufacturing and Scaling Axle Systems
Opportunities for Growth and Innovation
Threats from Competition and Supply Chain Challenges - Porter’s Five Forces
- By Value, 2019-2025
- By Volume, 2019-2025
- By Average Selling Price, 2019-2025
- By Axle Type (In Value %)
Drive Axles
Non-Drive Axles
Independent Axles
Dependent Axles - By Vehicle Type (In Value %)
Battery Electric Vehicles
Plug-in Hybrid Electric Vehicles
Hybrid Electric Vehicles - By Application (In Value %)
Passenger Electric Vehicles
Commercial Electric Vehicles
Electric Heavy-Duty Trucks
Electric Buses - By Material (In Value %)
Steel
Aluminum
Carbon Fiber
Composite Materials - By Region (In Value %)
North-East
West Coast
Midwest
South-East
South-West
- Market Share Analysis (Value & Volume Contribution)
- Cross Comparison Parameters(Product Portfolio Breadth, Axle Durability and, Performance Metrics, Regulatory Compliance and Certifications, Pricing and Cost Structure Alignment, Distribution & Sales Channels in the USA, Manufacturing & Localization Capabilities, Research & Development Investments, Strategic Partnerships and Alliances)
- SWOT Analysis of Key Players
- Pricing Analysis
- Detailed Company Profiles
Tesla Inc.
General Motors (GM)
Ford Motor Company
Dana Incorporated
ZF Friedrichshafen AG
Bosch Group
GKN Automotive
Magna International Inc.
Schaeffler Group
ABB Ltd.
Continental AG
Valeo SA
Aisin Seiki Co., Ltd.
Hyundai Mobis
JTEKT Corporation
- Demand & Utilization Metrics
- Procurement Models & Purchasing Cycles
- Decision-Making Framework for EV Manufacturers
- Budget Allocations for Axle Systems in EVs
- By Value, 2026-2030
- By Volume, 2026-2030
- By Average Selling Price, 2026-2030


 Request a Sample
 Ask for Customization
 Get a Quote
 Enquire Now