 Download PDF
Market Overview
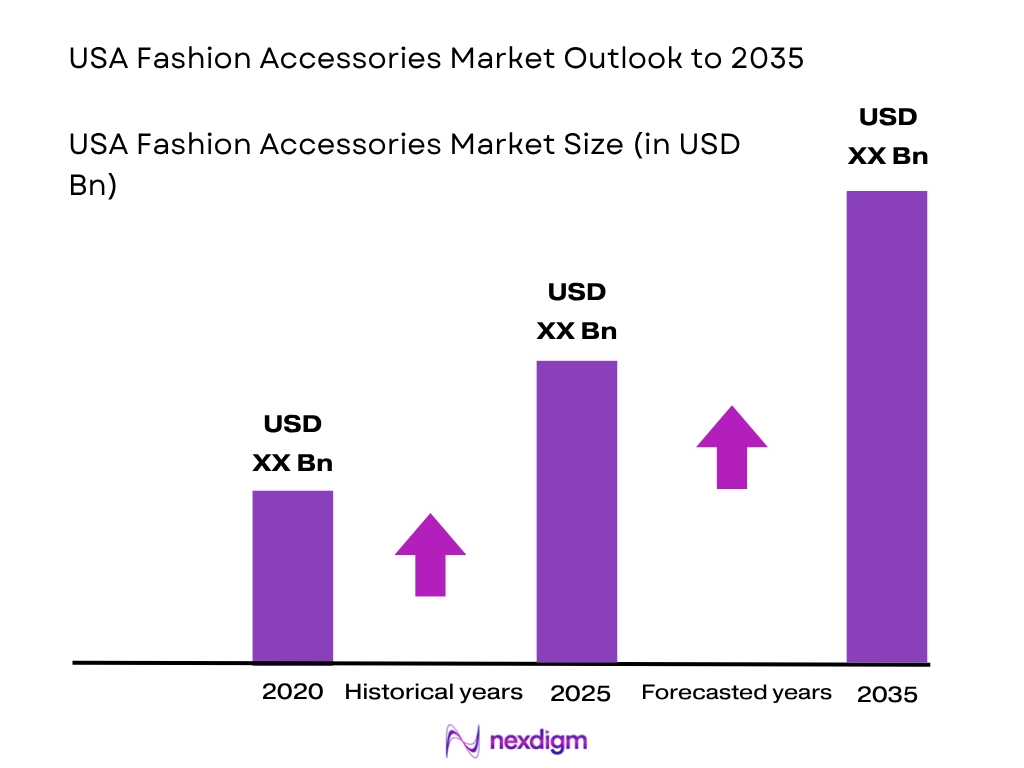
The USA fashion accessories market is valued at USD ~ billion for 2025, based on Nexdigm industry analysis of retail revenue across jewelry, handbags, watches, belts, wallets, and sunglasses. This figure reflects robust consumer spending on style‑driven products amid a stable retail environment and increasing digital sales channels. The market’s historical evolution shows expansion from post‑pandemic recovery toward heightened demand for expressive personal goods and luxury‑leaning accessories, particularly in high‑income urban areas.
Major cities such as New York, Los Angeles, and Chicago dominate the market due to their dense concentration of high‑end retail outlets, fashion houses, and flagship brand presences, which attract both domestic and international consumers. These hubs also benefit from strong tourism consumption, extensive media influence, and fashion event ecosystems that encourage trends and quick adoption. Retail infrastructure and affluent consumer bases in these regions create conditions for sustained accessory demand.
Market Segmentation
By Product Type
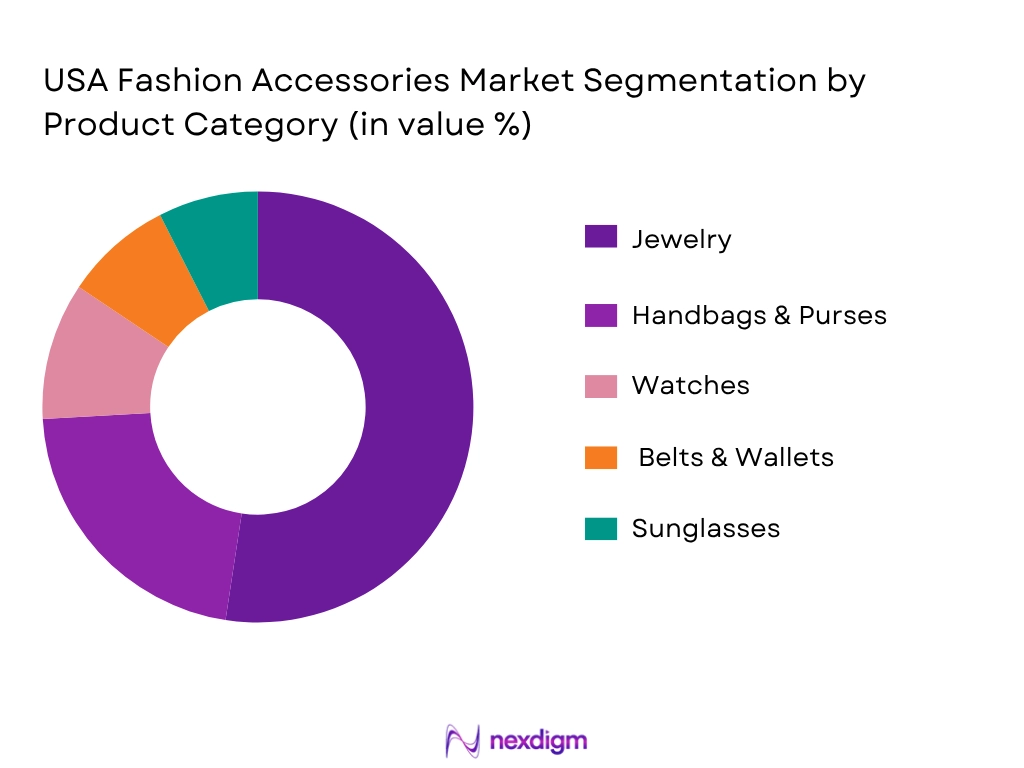
The USA fashion accessories market is segmented by product type into jewelry, handbags & purses, watches, belts & wallets, and sunglasses. In 2024, Jewelry held the dominant share of the product category segment, largely because jewelry combines emotional value, fashion appeal, and investment perception among consumers. High consumer affinity for gold, silver, and diamond accessories spanning from classic designs to trend‑led pieces—has sustained this leadership. The prominence of jewelry is also reinforced by recurring gifting occasions (e.g., holidays, milestones) and digital marketing campaigns that augment consumer visibility and propensity to purchase statement pieces. Premium and mid‑tier jewelry brands have deep distribution networks across both e‑commerce and specialty retail, strengthening their market footprint ahead of other accessory types.
By Distribution Channel
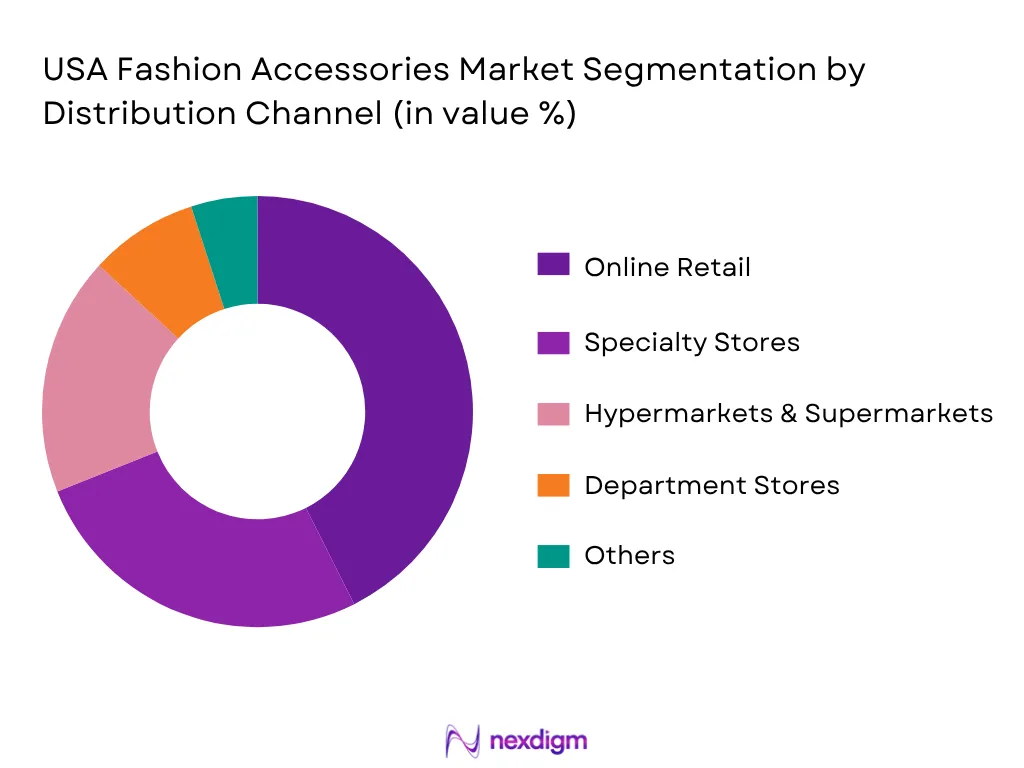
The market is segmented into online retail, specialty stores, hypermarkets & supermarkets, department stores, and other channels. Online retail emerged as the leading distribution channel in 2024, driven by widespread digital adoption, enhanced e‑commerce platforms, and mobile commerce convenience. Retailers across luxury and mass‑market segments have invested heavily in digital storefronts that integrate personalization algorithms, social commerce linkages, and rapid fulfillment, which increase conversion rates and encourage repeat purchases. Consumer preference for browsing extensive assortments, seasonal deals, and virtual try‑on technologies has further accelerated online sales. Specialty stores maintain performance through curated in‑store experiences, while broad‑format retailers use multi‑category offerings to retain value‑conscious shoppers.
Competitive Landscape
The USA fashion accessories market is consolidated around both legacy luxury conglomerates and major lifestyle brands that influence trends, distribution reach, and pricing power across segments. A handful of major players shape the competitive dynamics of the market. Luxury conglomerates leverage global scale, design innovation, and brand equity to capture high‑margin segments, while accessible fashion brands deploy omnichannel strategies and fast‑trend cycles to drive volume. This mix of global and domestic influence underscores the market’s diverse competitive structure.
| Company Name | Est. Year | Headquarters | Product Portfolio Breadth | Channel Reach (Retail + Online) | Brand Tier Position | Innovation & Sustainability Focus | Seasonal SKU Depth |
| LVMH Moët Hennessy Louis Vuitton SE | 1987 | Paris, France | ~ | ~ | ~ | ~ | ~ |
| Kering SA | 1963 | Paris, France | ~ | ~ | ~ | ~ | ~ |
| Tapestry, Inc. | 2017 | New York, USA | ~ | ~ | ~ | ~ | ~ |
| Michael Kors (Capri Holdings) | 1981 | New York, USA | ~ | ~ | ~ | ~ | ~ |
| Richemont International SA ADR | 1988 | Geneva, Switzerland | ~ | ~ | ~ | ~ | ~ |
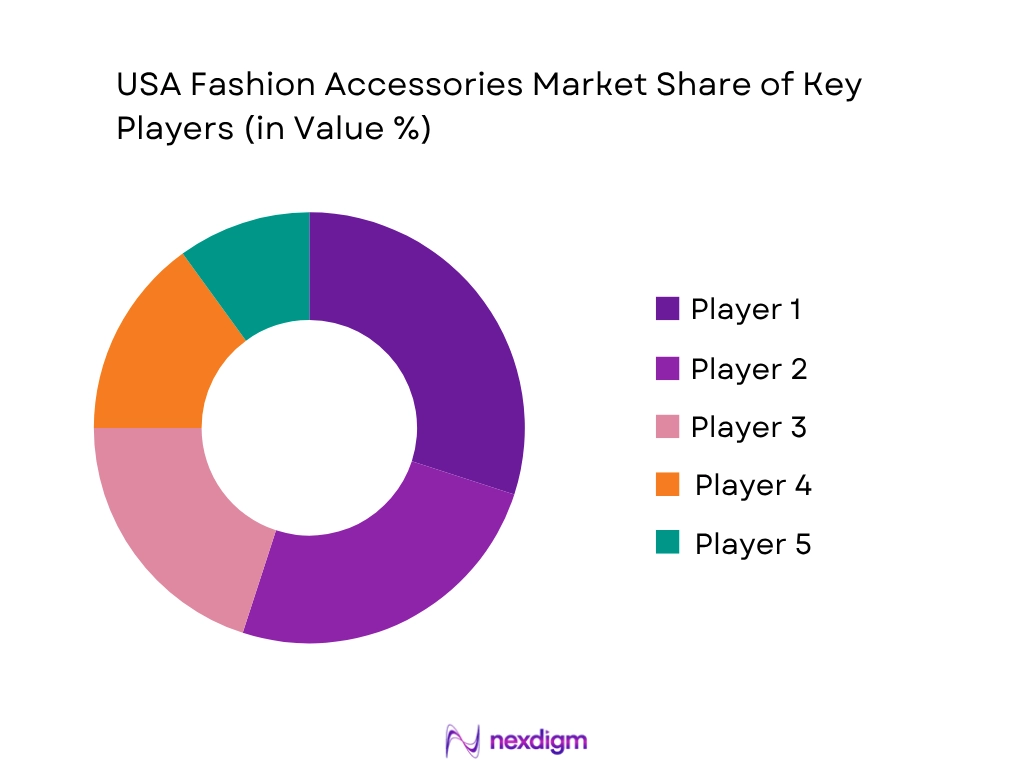
USA Fashion Accessories Market Analysis
Growth Drivers
Fashion Trend Cycles & Influencer Impact
Fashion in the United States is increasingly driven by rapid trend cycles and powerful influencer marketing, directly shaping accessory purchases. For example, U.S. retail e‑commerce sales reached USD 1,192.6 billion in 2024, up from USD 1,103.3 billion in 2023, with total e‑commerce accounting for 16.1 percent of U.S. retail sales, indicating strong digital purchase behavior that accessories brands can leverage. Moreover, social media activity directly affects discretionary spending: influencers and affiliate marketers drove about 20 percent of Cyber Monday e‑commerce revenue, showing that professional endorsements significantly increase purchase likelihood. U.S. average annual expenditure per household rose to USD 78,535 in 2024 from USD 77,158 in 2023, illustrating sustained consumer capacity for lifestyle and discretionary spending (which includes fashion accessories). This macro backdrop rising digital retail share, strong online consumer engagement, and increasing household expenditure is fueling accessories demand. Influencers accelerate trend adoption by exposing new designs and micro‑moments to large audiences, which translates into measurable sales lift across platforms and channels as shoppers increasingly rely on creator recommendations for style decisions.
E‑Commerce Adoption & Mobile Commerce Penetration
E‑commerce penetration in the U.S. is growing sharply, creating direct positive conditions for accessory sales online. According to the U.S. Census Bureau, total U.S. retail e‑commerce sales in 2024 were USD 1,192.6 billion, up from USD 1,103.3 billion, while e‑commerce’s share of total retail reached 16.1 percent. This expansion reflects heightened consumer comfort with ordering discretionary products like fashion accessories via digital channels. Mobile devices now account for a substantial portion of online shopping traffic, supported by increasing smartphone penetration across all age groups (the Pew Research Center reports over 85 percent of U.S. adults own a smartphone). These macro indicators demonstrate that U.S. consumers are not only willing to purchase online but are also engaging with fashion categories within this channel. In addition, social shopping via platforms that combine browsing and purchasing, supported by real‑time transactions, boosts convenience and reduces friction, encouraging shoppers to convert mobile impressions into sales. This shift is particularly relevant for fashion accessories, where visual aesthetics and instant trend validation increase mobile conversion rates. Therefore, strong growth in e‑commerce and mobile buying behavior underpins rising accessory sales outside traditional brick‑and‑mortar formats.
Market Challenges
Supply Chain Disruptions & Tariff Impacts
For U.S. fashion accessories, supply chain volatility and import dynamics present ongoing operational challenges. U.S. trade statistics from the Bureau of Economic Analysis show that in 2024, total imports of goods and services were USD 4,110 billion, compared with USD 3,856.7 billion in 2023, reflecting persistent reliance on global supply networks and associated logistics complexity. A large share of accessories such as leather goods and metal components is imported from global hubs (e.g., China, Mexico), meaning shifts in freight costs or port delays directly affect supply availability and delivery timing. The growing U.S. goods and services deficit, which expanded to USD 918.4 billion in 2024, underscores strong import volumes and the potential exposure of domestic fashion supply chains to global disruptions. Additionally, tariff policy uncertainty can raise input costs for imported materials, putting pressure on margins and complicating pricing strategies. Differences in tariff structures across categories (e.g., textiles vs. metals) require careful compliance and strategic sourcing. These macro trade and logistics indicators show that supply chain complexity and tariff costs remain material constraints for the U.S. fashion accessories market, necessitating contingency planning and diversified sourcing strategies to sustain reliable product flow.
Rising Raw Material Costs
Rising raw material costs present a significant challenge for the U.S. fashion accessories market, affecting both manufactured and imported goods. Many accessories rely on commodities such as leather, metals (for jewelry and hardware), and specialized textiles, all of which have seen input cost pressures. Although official commodity indexes reflect wide variation, U.S. import price data (which factors into raw inputs for fashion goods) shows import prices increased 4.2 percent over the 12 months through April 2026, the highest annual gain in several years. In practical terms, this means increased cost bases for imported finished goods and components, which can compress retail margins or force price adjustments that hurt consumer demand. Rising energy and fuel import costs, such as a 16.3 percent increase in imported fuel prices noted over a recent period, also feed into logistics and manufacturing costs. Given that fashion accessories often combine multiple material inputs, these macro price pressures translate directly into higher landed costs, particularly for brands that cannot leverage large-scale purchasing. As a result, raw material cost inflation represents a persistent headwind for pricing stability and profitability across the U.S. accessories supply chain.
Opportunities
Digital Personalization & AR Try‑On Technologies
Digital personalization and augmented reality (AR) technologies are reshaping how consumers discover, evaluate, and purchase fashion accessories online. In 2024, U.S. retail e‑commerce sales reached USD 1,192.6 billion, with e‑commerce comprising 16.1 percent of total retail trade, reflecting broad digital engagement and a ready audience for immersive online tools. Personalization engines that recommend accessories based on browsing or purchase history increase relevance and average order value. AR try‑on features allow customers to virtually test handbags, sunglasses, and jewelry before purchase reduce uncertainty, helping convert browsers into buyers and lowering return rates. Although specific AR adoption rates in accessories are emerging, the macro trend of increasing e‑commerce share indicates that U.S. shoppers are comfortable engaging with sophisticated online interfaces. Personalized digital experiences encourage higher engagement and loyalty by delivering curated recommendations tailored to individual preferences, which is particularly impactful for visual and style‑driven categories like accessories. With rising mobile commerce use and tech‑savvy consumer cohorts, digital personalization and AR tools present a strategic opportunity for brands to differentiate offerings and enhance conversion.
Circular Economy & Resale Market Integration
The circular economy and resale market present growing opportunities for fashion accessories brands to capture consumer interest and drive repeat engagement. U.S. consumer spending climate remains strong, as evidenced by USD 78,535 average annual expenditures per consumer unit in 2024, indicating that shoppers allocate significant discretionary budgets some of which increasingly favor sustainable and value‑oriented segments. For fashion accessories, integrating resale platforms or buy‑back programs appeals to environmentally conscious consumers and extends product life cycles. Major resale channels now list high‑quality handbags, watches, and jewelry, enabling brands to capture second‑hand value while building sustainability narratives. The broader adoption of resale mirrors consumer demand for affordability and unique items, with macro retail shifts toward online channels supporting secondary market growth. As online fashion resale platforms expand listing volumes and reach, accessories brands that strategically partner or build proprietary resale ecosystems can harness this demand to attract new cohorts and unlock lifetime value beyond initial purchases. Though resale penetration varies by category, macro purchasing power and growing sustainability preferences signal that circular economy integration is a viable opportunity for long‑term accessory market resilience and differentiation.
Future Outlook
Over the next decade, the USA fashion accessories market is expected to maintain robust growth driven by continued digital commercialization, sustainability‑linked consumer preferences, and personalization strategies. E‑commerce tech enhancements, such as augmented reality (AR) try‑ons and AI‑enabled style assistants, will further elevate purchase experiences and expand penetration. Growth in premium and luxury segments will be supported by rising discretionary spending in affluent cohorts, while mid‑tier segments benefit from social media‑driven trend cycles. The convergence of fashion and tech innovation—alongside a maturing resale ecosystem—positions the market for sustained expansion through strategic collaborations, material innovation, and experiential retail models.
Major Players
- LVMH Moët Hennessy Louis Vuitton SE
- Kering SA
- Tapestry, Inc.
- Michael Kors (Capri Holdings)
- Richemont International SA ADR
- Chanel SA
- Hermès International SA
- Burberry Group plc
- Prada S.p.A.
- Tiffany & Co.
- Fossil Group, Inc.
- Guess?, Inc.
- Nike, Inc. (accessories division)
- Adidas AG (accessories division)
- Tory Burch LLC
Key Target Audience
- Retail and Lifestyle Investment Funds
- Fashion Brand Licensing & Equity Investors
- Luxury Goods Traders
- E‑Commerce Platform Strategists
- Retail Real Estate Developers
- Consumer Goods Import/Export Associations
- Government and Regulatory Bodies (U.S. Federal Trade Commission, Consumer Product Safety Commission)
- Investments and Venture Capitalist Firms (consumer & fashion sector funds)
Research Methodology
Step 1: Identification of Key Variables
This phase involves mapping the fashion accessories ecosystem, reviewing product types, distribution channels, consumer demographics, and supply chain nodes using secondary sources including industry reports, retail databases, and trade publications.
Step 2: Market Analysis and Construction
Historical data on retail revenues, unit sales, online penetration, and channel performance are compiled through secondary sources, retail scanners, and industry datasets to determine baseline market sizing and value trends.
Step 3: Hypothesis Validation and Expert Consultation
Key market forecasts and assumptions are validated through interviews with industry stakeholders, fashion retail professionals, and supply chain experts, to refine pricing, demand drivers, and competitive positioning.
Step 4: Research Synthesis and Final Output
The synthesis stage integrates bottom‑up revenue build‑up with primary insights to produce validated market size, segmentation performance, and forward‑looking forecasts. Quality checks ensure alignment with credible sources and cross‑reference consistency.

- Executive Summary
- Research Methodology (Market Definitions and Scope, Abbreviations, Market Sizing Framework, Data Collection Approaches, Sampling and Weighting Methods, Retail Scanner & POS Data Integration, Primary & Secondary Validation Protocols, Forecast Modeling Logic, Data Reliability & Limitations)

- Definition and Scope
- Market Genesis and Evolution
- Sector Value Chain and Supply Chain Dynamics
- Retail Landscape and Channel Transformation
- Consumer Demand Drivers and Behavioral Shifts

- Growth Drivers (Fashion Trend Cycles & Influencer Impact, E‑Commerce Adoption & Mobile Commerce Penetration, Brand Collaborations and Limited Editions, Consumer Sustainability Preferences )
- Market Challenges (Supply Chain Disruptions & Tariff Impacts, Rising Raw Material Costs (leather, metals), Counterfeiting and Gray Market Sales)
- Opportunities (Digital Personalization & AR Try‑On Technologies, Circular Economy & Resale Market Integration, Direct‑to‑Consumer (DTC) Brand Expansion )
- Trends (Fast Fashion vs Slow Fashion Dynamics, Subscription & Rental Fashion Services, Seasonal SKU Optimization )
- Regulatory Environment (Product Safety, Labeling Standards, Import Compliance)
- Value Chain and Supply Chain Analysis (raw material sourcing (domestic vs imports), manufacturing nodes, logistics hubs, wholesale distribution, retail fulfillment efficiency, quality assurance standards)
- Pricing Dynamics and Margin Stack (ASP by category, luxury vs mass-market pricing, promotional cadence, gross & contribution margins, channel economics, cost pass-through)
- Private Label vs Branded Landscape (price positioning, brand loyalty/trust gap, innovation frequency, exclusive collections, shelf productivity and online visibility)
- SWOT Analysis of Industry
- Stakeholder Ecosystem (Manufacturers, Retailers, Distributors, Fashion Brands, E-commerce Platforms, Government Agencies)
- Porter’s Five Forces Analysis
- Competitive Landscape Overview (major players influence, market consolidation, distribution reach, pricing power, innovation pipeline)

- By Market Value (2020-2025)
- By Market Volume (2020-2025)
- By Average Selling Price (2020-2025)

- By Product Category (In Value %)
Handbags & Wallets
Belts & Buckles
Scarves & Wraps
Hats & Caps
Jewelry - By Consumer Demographic (In Value %)
Women
Men
Gen Z
Millennials
Baby Boomers - By Distribution Channel (In Value %)
Department Stores
Specialty Fashion Retailers
E‑Commerce Marketplaces
Brand‑Owned Online Stores
Discount & Off‑Price Outlets - By Price Tier (In Value %)
Luxury (>USD threshold)
Premium
Mid‑Tier
Value / Affordable - By Material/Design Origin (In Value %)
Leather & Natural Materials
Metals & Precious Materials
Textile & Synthetic Materials
Eco‑Friendly/Sustainable Materials

- Competitive Landscape and Market Concentration (top-player dominance, market fragmentation, emerging brand pressure, portfolio breadth across jewelry, handbags, watches, belts, and sunglasses)
- Market Share of Major Players by Value and Volume (overall market share, category-wise share, channel-wise share, branded vs private-label accessories)
- Cross Comparison Parameters (product portfolio depth, distribution reach (flagship & multi-channel), online DTC penetration %, innovation cadence, ASP by SKU, sustainability credentials, material traceability score, limited-edition/seasonal release frequency)
- Category-Claim Benchmarking (luxury, premium, mass-market, sustainable materials, vegan leather, ethically sourced, tech-enabled features, customization offerings)
- SKU Pricing and Pack Architecture Analysis (ASP by category, promotional depth, assortment ladder, SKU size and material normalization, bundle/kit offerings)
- SWOT Analysis (strengths, weaknesses, opportunities, threats of major competitors)
- Manufacturing Footprint and Capacity Analysis (owned manufacturing units, third-party manufacturing mix, fill-finish capability, domestic vs import split, batch/limited-edition flexibility)
- Certifications, Claims, and Innovation Benchmarking (eco-certifications, sustainability claims, ethical sourcing proof, new-launch cadence, signature/hero product innovation)
- Detailed Profiles of Major Players
Tapestry, Inc.
Capri Holdings Limited
Michael Kors
Coach
Kate Spade
Fossil Group, Inc.
Ralph Lauren Corporation
Guess?, Inc.
Steve Madden
PVH Corp.
Columbia Sportswear
VF Corporation
Urban Outfitters, Inc.
Amazon Fashion
Target Corporation (In‑house Brand Accessories)

- Buyer Cohort Profiling (age, gender, income level, lifestyle orientation, fashion-consciousness, urban vs suburban residence)
- Purchase Drivers and Barriers (brand reputation, price sensitivity, trend adoption, sustainability perception, availability, counterfeit concerns)
- Shopper Journey and Decision Funnel (awareness channels, influencer/social media impact, trial triggers, review & rating influence, purchase friction points, repurchase motivators)
- Channel Behavior Analysis (discovery channels, purchase channels (online vs offline), replenishment frequency, basket mission (occasional vs daily use), cross-category bundling)
- E-Commerce, DTC, and Social Commerce Analysis (traffic source, customer acquisition cost (CAC), conversion rate, subscription/rental service mix, repeat purchase rate, AR/VR engagement)
- Basket Composition and Repurchase Economics (cross-sell & upsell rates, attach rate per category, replenishment cycles, bundle adoption, seasonal SKU preference)
- Retailer and Influencer/Stylist Influence (shelf curation, influencer endorsements, stylist recommendation, personal shopper input, fashion event-driven purchase triggers)

- By Market Value (2026-2035)
- By Market Volume (2026-2035)
- By Average Selling Price (2026-2035)


 Request a Sample
 Ask for Customization
 Get a Quote
 Enquire Now