
 Download PDF
 Download PDF
Market Overview
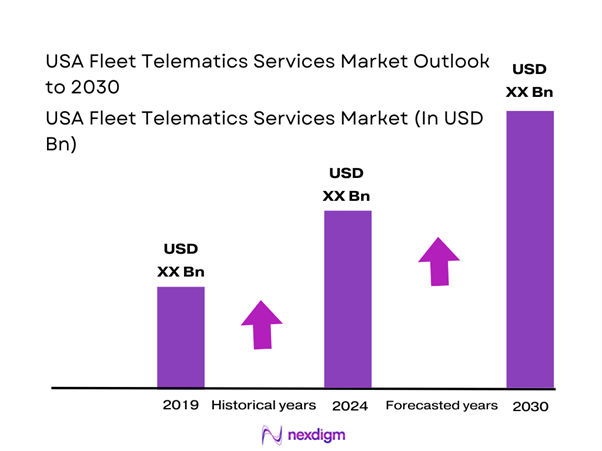
The USA Fleet Telematics Services Market is sized around USD ~ billion in the latest year, following an estimated USD ~ billion in the prior year, as reflected in industry tracking of fleet telematics systems (hardware + software) revenue in the country. The market size is being driven by fleet digitization priorities—real-time visibility, safety risk reduction, compliance workflows, and operating-cost control—where telematics data (GPS + device diagnostics + driver behavior signals) is increasingly treated as a “system of record” for dispatch, maintenance, and claims operations.
Dominant US operating hubs that shape telematics demand include California and the broader West, alongside the South’s fast-scaling logistics and field-service corridors, where dense freight movement, port/rail-fed distribution, and rapid last-mile buildouts amplify the need for routing intelligence, uptime analytics, and safety tooling. In provider concentration terms, US enterprise adoption also clusters around major logistics nodes and metro-heavy delivery regions (e.g., large multi-state networks), because these fleets gain the quickest ROI from standardized ELD workflows, centralized coaching, and multi-terminal performance benchmarking.
Market Segmentation
By Telematics Type
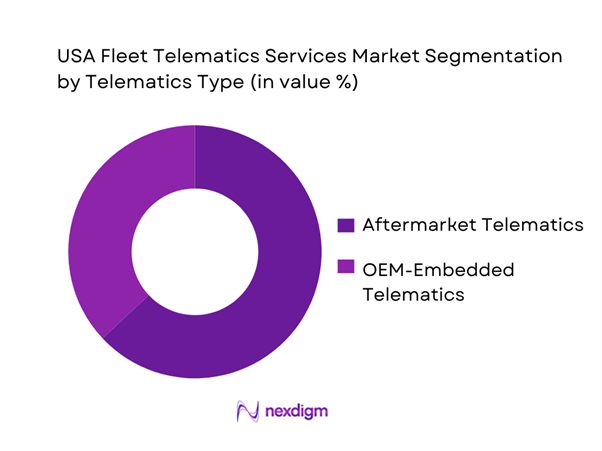
USA Fleet Telematics Services Market is segmented into aftermarket telematics and OEM-embedded telematics. Recently, aftermarket telematics has a dominant market share because it is the fastest way for fleets to standardize across mixed vehicle makes, model years, and asset types without waiting for OEM refresh cycles. Aftermarket devices also support rapid scaling for seasonal capacity (rental, surge, subcontracted fleets) and let operators choose best-fit platforms for compliance workflows, safety coaching, routing, temperature/asset sensors, and multi-camera video—often through modular add-ons. In industries where vehicle lifecycles are long (work trucks, vocational fleets), retrofitting is essential to digitize legacy units. Aftermarket ecosystems also tend to be more integration-friendly (open APIs, marketplace connectors), enabling fleets to unify dispatch/TMS, maintenance, fuel, and insurance systems into one operating layer—making switching costs and platform stickiness structurally higher.
By Vehicle Category
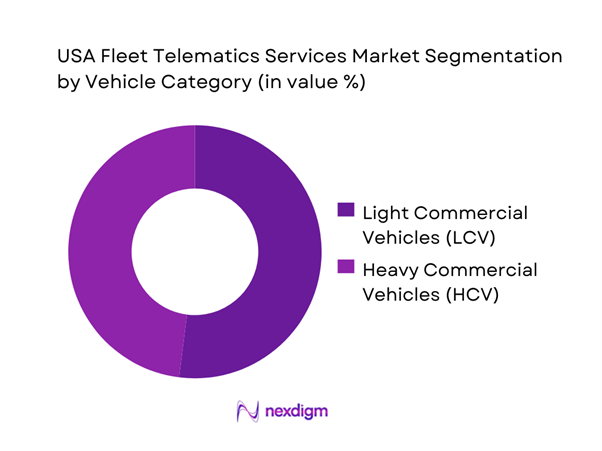
USA Fleet Telematics Services Market is segmented into light commercial vehicles and heavy commercial vehicles. Recently, LCVs have a dominant market share because the US delivery economy increasingly runs on high-stop, high-density operations where route efficiency, proof-of-service, and driver safety are managed minute-by-minute. LCV fleets also expand faster across parcel, grocery, retail replenishment, home services, and technician networks—creating a larger addressable base for telematics subscriptions and add-on modules (navigation optimization, idling control, driver scorecards, incident capture). Additionally, LCV operators often manage larger driver pools with higher churn than long-haul trucking, which raises the value of automated onboarding, standardized coaching, and mobile-first workflows. Finally, LCV platforms are typically deployed as cloud-first tools with lightweight hardware, enabling quicker installation, easier device swaps, and faster cross-region rollout—accelerating adoption versus heavier, more customized deployments.
Competitive Landscape
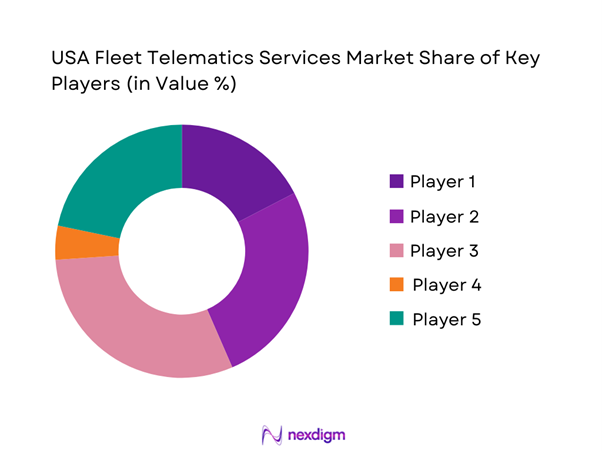
The USA Fleet Telematics Services Market is competitive but platform-led, with a set of scaled vendors anchoring large enterprise deployments while fast-growing software-native providers expand via video telematics, AI safety analytics, and deep integrations into dispatch/TMS, maintenance, fuel, and insurance workflows. This creates a landscape where differentiation is less about “tracking” and more about time-to-value, data quality, coaching automation, compliance depth, and ecosystem breadth.
| Company | Est. Year | Headquarters | Core Telematics Strength | Video Telematics Depth | Compliance/ELD Strength | Integration Ecosystem | Typical Fleet Fit | Route-to-Market |
| Verizon Connect | 1986 | USA | ~ | ~ | ~ | ~ | ~ | ~ |
| Samsara | 2015 | USA | ~ | ~ | ~ | ~ | ~ | ~ |
| Geotab | 2000 | Canada | ~ | ~ | ~ | ~ | ~ | ~ |
| Motive | 2013 | USA | ~ | ~ | ~ | ~ | ~ | ~ |
| Trimble (Transportation) | 1978 | USA | ~ | ~ | ~ | ~ | ~ | ~ |
USA Fleet Telematics Services Market Analysis
Growth Drivers
FMCSA compliance digitization
FMCSA’s ELD framework requires eligible carriers to keep electronic Records of Duty Status, and an ELD automatically captures operational fields such as miles driven and engine hours—data points that push fleets toward digital compliance workflows instead of paper processes. That compliance pull is amplified by the scale of regulated trucking: FMCSA registration statistics show ~ carriers, ~ drivers, and ~ vehicles in the active registry footprint that telematics platforms target with ELD + DVIR + inspection and audit-readiness modules. On the macro side, the operational need for higher dispatch productivity and HOS-aware planning sits inside a very large economy: the World Bank reports US GDP at USD ~, which correlates with high freight intensity and compliance exposure across multi-state operations. Fleets adopt telematics not just to “log hours,” but to hardwire compliance into dispatch logic (HOS remaining, break timing, route feasibility) and to keep defensible digital records at scale, especially in mixed fleets where standardized back-office enforcement is difficult without centralized systems.
Rising insurance and liability exposure
Fleet telematics demand rises when operational risk becomes more visible and more costly to manage—especially as road safety outcomes remain severe at the national level. NHTSA’s early estimate shows ~ traffic fatalities in the latest year versus ~ in the prior year, keeping “crash exposure” structurally high for commercial fleets that operate millions of miles across diverse road conditions. FMCSA’s Large Truck and Bus Crash Facts reports ~ large trucks involved in fatal crashes, ~ large trucks involved in injury crashes, and ~ large trucks involved in property-damage-only crashes—counts that underpin why fleets invest in telematics for safety policy enforcement (speeding/harsh events), incident reconstruction, and defensible coaching documentation. The exposure is supported by macro throughput: FHWA’s Traffic Volume Trends indicates cumulative US travel reaching ~ vehicle miles, which creates more interaction density between commercial vehicles and general traffic—raising the value of continuous monitoring and risk scoring. Telematics (especially video + behavior analytics) becomes a risk-control layer that lets fleets identify high-frequency risky patterns, prove corrective actions, and maintain audit trails of coaching—capabilities that insurance partners increasingly expect when underwriting commercial auto risk.
Challenges
Driver privacy and labor resistance
The operational case for telematics often collides with perceived surveillance, especially when solutions expand from GPS to in-cab video, audio triggers, and continuous driver scoring. Fleets must manage this challenge at scale: FMCSA registration data reflects ~ drivers and ~ carriers, meaning adoption frictions are not niche—policy consistency and trust frameworks must work across millions of driver relationships and diverse employment structures (company drivers, contractors, seasonal drivers). Safety context makes the tension sharper: NHTSA estimates ~ fatalities nationally in the latest year, which pushes fleets to implement stronger monitoring and coaching even as privacy sensitivity rises. The macro backdrop matters because high utilization is persistent in a very large economy: the World Bank reports US GDP at USD ~, which supports heavy freight movement and tight service expectations—conditions that increase both monitoring incentives and resistance risk. Effective programs therefore shift from “tracking people” to “managing risk”: clear policy definitions (when video is reviewed), role-based access control, and documented coaching processes that emphasize safety outcomes. Without that governance, fleets see slower adoption, device tampering behaviors, and higher turnover in sensitive segments like last-mile and vocational operations where driver-manager trust is a critical operating asset.
Integration complexity with TMS and ERP systems
Telematics value is unlocked when data flows into the systems fleets already run—TMS for dispatch and billing, ERP for asset and cost tracking, HR for workforce administration, and maintenance systems for work orders. The complexity is partly structural: the US economy’s software intensity is high, and private fixed investment in information processing equipment and software reaches USD ~ (seasonally adjusted annual rate), implying large installed bases of software stacks that telematics must integrate with. Operational scale amplifies the burden: FMCSA shows ~ vehicles and ~ carriers in the registry footprint, creating diverse combinations of TMS/ERP tools, terminal processes, and data standards. Freight variability also pressures real-time integration: FHWA’s Traffic Volume Trends cites cumulative travel of ~ vehicle miles, increasing the frequency of ETA exceptions and dispatch changes that require synchronized data across platforms. In practice, integration complexity shows up as slow deployments, inconsistent KPI definitions across systems, and duplicate “sources of truth” for stops, dwell, and driver events. Fleets increasingly demand open APIs, robust middleware connectors, and pre-built integrations because custom integration work becomes a hidden operational cost—measured in IT backlog, delayed rollouts, and limited ability to scale from pilots to multi-terminal standardization.
Opportunities
AI-based safety scoring and insurance partnerships
The opportunity is to convert safety data into measurable risk reduction programs that insurers can recognize—without relying on future projections. The safety baseline is large: NHTSA estimates ~ fatalities nationally in the latest year, and FMCSA reports ~ large trucks involved in fatal crashes plus ~ large trucks involved in injury crashes in a recent annual reference set—numbers that keep liability prevention a continuous operational priority. AI-based scoring builds on current telematics primitives (hard braking, speeding patterns, following distance proxies, distraction signals where video is deployed) to create repeatable, auditable “coaching actions” and to document corrective interventions. The scale of fleets that can participate is substantial: FMCSA registration statistics list ~ carriers, ~ drivers, and ~ vehicles, creating a broad population where insurers and fleets can collaborate on structured safety programs and defensible evidence workflows. Macro conditions support institutionalization: the World Bank reports US GDP at USD ~, consistent with high freight and service activity where insurers are motivated to differentiate risk selection and fleets are motivated to stabilize incident frequency. This opportunity favors vendors that can produce transparent score explainability, incident evidence packaging, and measurable program governance (coaching completion records, repeat-event suppression), enabling insurance partnerships rooted in operational proof rather than marketing narratives.
OEM embedded telematics monetization
OEM embedded telematics expands the market by reducing install friction and enabling “factory data” to be activated through software services, while current aftermarket deployments still matter for mixed fleets. The scale conditions are already visible: FMCSA registration statistics list ~ vehicles, meaning there is a very large installed base where OEM connectivity (for newer units) and aftermarket retrofits (for older units and specialty assets) will coexist in fleet stacks. Fleet digital readiness is reinforced by US software investment intensity: private fixed investment in information processing equipment and software stands at USD ~ (seasonally adjusted annual rate), indicating that US businesses continue to spend heavily on software systems that can ingest OEM data feeds via APIs and monetize them through workflows. Demand-side throughput remains high: total retail e-commerce sales are reported at USD ~, increasing pressure for predictable ETAs, preventive maintenance execution, and asset utilization analytics—use cases that OEM data can support when unified across fleet systems. The opportunity is therefore not “OEM vs aftermarket,” but monetization through interoperability: OEM data streams become valuable when they plug into TMS/maintenance/safety tooling and when fleets can standardize KPIs across mixed vehicle populations without losing governance, security, or operational control.
Future Outlook
Over the next phase of market evolution, USA fleet telematics growth is expected to be shaped by three compounding shifts: video + AI safety becoming a default layer for claims defensibility and driver coaching, predictive maintenance moving from alerts to automated work-order orchestration, and platform consolidation as fleets rationalize vendors and demand one data spine across vehicles, drivers, and assets. At the same time, OEM-embedded telemetry will expand, but aftermarket platforms will remain critical for mixed fleets and multi-asset visibility.
Major Players
- Verizon Connect
- Samsara
- Geotab
- Motive
- Trimble Transportation
- Omnitracs
- Lytx
- Teletrac Navman
- GPS Insight
- Azuga
- Powerfleet
- Zonar Systems
- Spireon
- Fleet Complete
Key Target Audience
- Fleet owners/operators
- Shippers and 3PLs managing contracted carrier performance
- Commercial vehicle leasing and rental fleet operators
- Insurance and risk/claims stakeholders
- Automotive OEMs, upfitters, and dealer commercial-vehicle groups
- Investments and venture capitalist firms
- Government and regulatory bodies
- Public sector fleet administrators
Research Methodology
Step 1: Identification of Key Variables
We build an ecosystem map covering telematics platform vendors, device manufacturers, connectivity enablers, resellers/installers, and fleet end-users. Desk research consolidates definitions (fleet telematics services vs systems), revenue boundaries, and module scope (ELD, safety, video, maintenance, routing) to set the sizing framework.
Step 2: Market Analysis and Construction
We compile historical market signals (install base trends, subscription attach, device shipments where available) and align them to revenue logic across software subscriptions, hardware/device revenue, connectivity, and managed services. We also map demand by fleet archetype (LCV delivery, long-haul, vocational, public fleets) and operational intensity.
Step 3: Hypothesis Validation and Expert Consultation
We validate assumptions via structured expert interviews (CATIs) with fleet operations leaders, safety managers, and channel partners (installers, resellers). Discussions focus on buying triggers, replacement cycles, module adoption (video/AI), and integration requirements that determine vendor selection and expansion.
Step 4: Research Synthesis and Final Output
We triangulate outputs against published market sizing references and vendor positioning signals, then finalize segmentation logic, competitive benchmarking, and forward-looking themes. The end output emphasizes decision-grade insights (use-case ROI logic, adoption barriers, and platform differentiation).
- Executive Summary
- Research Methodology (Market definitions and scope boundaries, assumptions and exclusions, abbreviations, triangulation logic, bottom-up sizing, top-down sizing, primary interview mix, expert validation, data-quality scoring, limitations and sensitivity checks)
- Definition and Scope
- Market Genesis and Evolution
- Industry Timeline of Major Platform Shifts
- Fleet Operating Cycle Linkage
- End-to-End Value Chain and Data Flow

- Growth Drivers
FMCSA compliance digitization
Rising insurance and liability exposure
Driver retention and safety coaching demand
Shipper visibility and ETA requirements
Maintenance cost optimization - Challenges
Driver privacy and labor resistance
Integration complexity with TMS and ERP systems
Installation downtime and hardware heterogeneity
SMB fleet churn and price sensitivity
Cybersecurity and data governance risks - Opportunities
AI-based safety scoring and insurance partnerships
OEM embedded telematics monetization
Electric and mixed-fleet management solutions
Asset and equipment telematics expansion
Predictive maintenance and analytics-led upselling - Trends
Video-first buying behavior
Platform consolidation and ecosystem bundling
Open API and marketplace expansion
Edge AI and real-time analytics adoption
Private equity-led consolidation - Regulatory & Policy Landscape
- SWOT Analysis
- Stakeholder & Ecosystem Analysis
- Porter’s Five Forces Analysis
- Competitive Intensity & Ecosystem Mapping
- By Value, 2019–2024
- Installed Base, 2019–2024
- Service Revenue Mix, 2019–2024
- By Fleet Type (in Value %)
Light-duty fleets
Medium-duty fleets
Heavy-duty fleets
Vocational fleets
Mixed fleets - By Application (in Value %)
GPS tracking and location intelligence
ELD and compliance management
Video telematics and driver safety
Maintenance and diagnostics
Fuel and idle management - By Technology Architecture (in Value %)
OBD-based devices
Hardwired telematics gateways
Camera-first AI systems
OEM-embedded telematics
Mobile app and tablet-based systems - By Connectivity Type (in Value %)
Single-carrier cellular connectivity
Multi-carrier connectivity
Managed connectivity services
Offline buffering and store-and-forward systems - By End-Use Industry (in Value %)
Truckload and over-the-road freight
Last-mile and parcel delivery
Construction and infrastructure
Utilities and field services
Government and public sector
Food and beverage and cold chain - By Region (in Value %)
Northeast
Midwest
South
West
- Competitive positioning matrix
Market share analysis - Cross Comparison Parameters (compliance depth, video telematics and AI maturity, integration and API ecosystem strength, hardware portfolio and install scalability, analytics and benchmarking capability, connectivity resilience, total cost architecture, vertical-specific workflow fit)
- Competitive moat assessment
- Partnership and channel strategy analysis
- SWOT analysis of major players
- Detailed Profiles of Major Companies
Verizon Connect
Samsara
Geotab
Motive
Omnitracs
Trimble Transportation
Teletrac Navman
Lytx
Netradyne
Zonar Systems
GPS Insight
Azuga
Fleet Complete
Spireon
- Use-case prioritization by vertical
- Fleet KPI benchmarking framework
- Buying journey and decision rights
- Vendor selection criteria
- Adoption and change management
- By Value, 2025–2030
- Installed Base (Connected Vehicles and Assets), 2025–2030
- Service Revenue Mix, 2025–2030


 Request a Sample
 Ask for Customization
 Get a Quote
 Enquire Now