 Download PDF
Market Overview
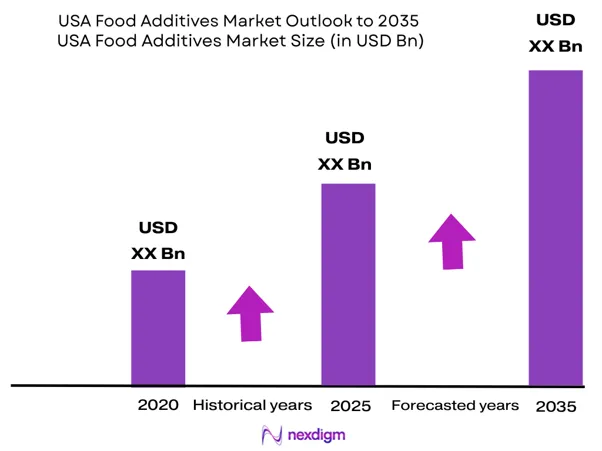
The USA Food Additives Market is valued at USD ~ billion, based on a five-year historical analysis, and is forecasted to grow at a CAGR of ~% during the forecast period. Demand is driven by flavors, sweeteners, preservatives, colors, emulsifiers, stabilizers, thickeners, enzymes, acidulants and processing aids. U.S. food spending reached USD 2.51 trillion after USD 2.41 trillion, while GDP reached USD 29.18 trillion, supporting packaged food and beverage formulation demand. California, Illinois, New Jersey, New York, Texas, Georgia, Pennsylvania, Ohio, Minnesota, Iowa and Wisconsin dominate the USA Food Additives Market due to food manufacturing density, flavor and fragrance hubs, starch and sweetener processing, dairy ingredients, bakery and snack production, meat processing and beverage innovation. Food manufacturing remains the largest U.S. manufacturing subsector by shipments at USD 904.1 billion, supporting demand for additive systems used in shelf life, taste, color, texture and processing.
Market Segmentation
By Additive Function
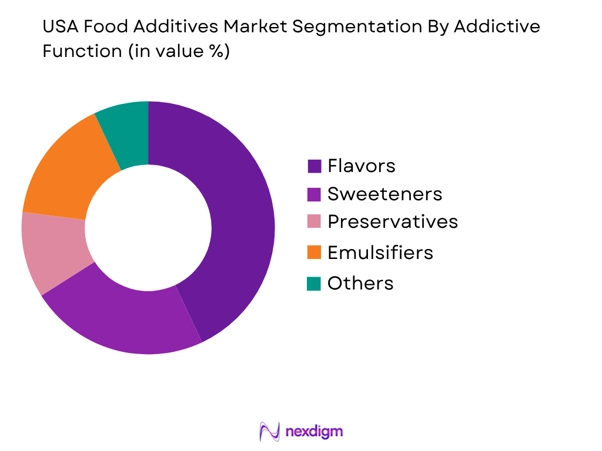
USA Food Additives Market is segmented by additive function into flavors and flavor enhancers, sweeteners, preservatives, colors, emulsifiers, stabilizers, thickeners, acidity regulators, antioxidants, enzymes, texturizers, humectants, anti-caking agents, leavening agents, nutrient additives and processing aids. Recently, flavors and flavor enhancers have had a dominant market share under the additive function segmentation due to their central role in beverages, snacks, bakery, dairy, confectionery, sauces, frozen foods, plant-based foods and functional nutrition products. Flavor systems are used not only to create taste, but also to mask off-notes from protein, fiber, high-intensity sweeteners, vitamins, minerals and reduced-sugar formulations. Beverage innovation, limited-time offerings, ethnic flavors, clean-label launches and private-label reformulation support demand. Sweeteners, preservatives and texture systems remain important, but flavor remains structurally dominant because every packaged food category uses taste differentiation to defend repeat purchase and brand identity.
By Application
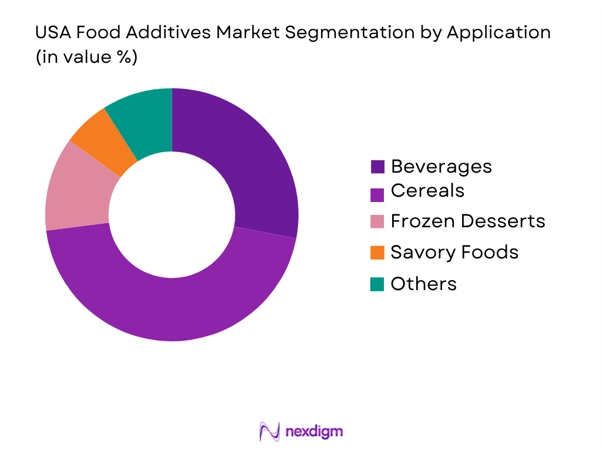
USA Food Additives Market is segmented by application into beverages, bakery and cereals, dairy and frozen desserts, confectionery, snacks and savory foods, meat, poultry and seafood processing, sauces, dressings and condiments, ready meals, frozen foods, plant-based foods, nutritional foods, functional foods, foodservice ingredients and pet food ingredients. Recently, beverages have had a dominant market share under the application segmentation because they require flavor systems, sweetener blends, acidulants, colors, emulsifiers, preservatives, clouding agents, stabilizers, vitamins, minerals and functional ingredients. Carbonated soft drinks, energy drinks, sports drinks, ready-to-drink coffee, tea, flavored water, protein beverages and functional beverages continuously depend on additive-driven formulation. Beverage manufacturers also reformulate more frequently than many food categories because taste profiles, sugar levels, colors, functional claims and limited-edition launches change rapidly. Bakery, dairy and snacks remain large additive users, but beverages dominate due to high innovation frequency and complex formulation systems.
Competitive Landscape
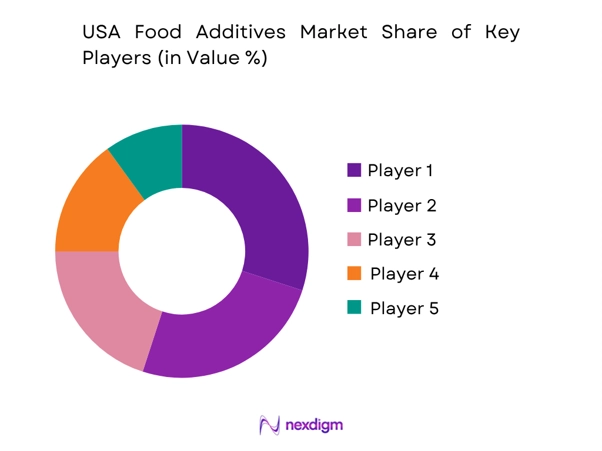
The USA Food Additives Market is led by large ingredient companies, flavor houses, starch and sweetener producers, enzyme specialists, natural color suppliers and clean-label formulation platforms. Cargill, ADM, IFF, Kerry Group and Ingredion are major players due to broad additive portfolios, U.S. manufacturing footprints, application labs, food manufacturer relationships, regulatory support and co-development capabilities. Competition is shaped by clean-label reformulation, FDA/GRAS support, natural color replacement, sugar reduction, texture optimization, supply reliability and technical service strength. FDA’s revocation of FD&C Red No. 3 and its post-market review activity have increased the value of regulatory preparedness and reformulation expertise.
| Company | Establishment Year | Headquarters | Core Portfolio | Technical Capability | Key End Users | Channel Strength | Regulatory / Clean Label Focus | Market-Specific Advantage |
| Cargill | 1865 | Minnesota, USA | ~ | ~ | ~ | ~ | ~ | ~ |
| ADM | 1902 | Illinois, USA | ~ | ~ | ~ | ~ | ~ | ~ |
| International Flavors & Fragrances | 1889 | New York, USA | ~ | ~ | ~ | ~ | ~ | ~ |
| Kerry Group | 1972 | Tralee, Ireland / U.S. operations | ~ | ~ | ~ | ~ | ~ | ~ |
| Ingredion | 1906 | Illinois, USA | ~ | ~ | ~ | ~ | ~ | ~ |
USA Food Additives Market Analysis
Growth Drivers
Packaged Food Manufacturing Scale and Formulation Intensity
The scale of U.S. food manufacturing is a core growth driver for the USA Food Additives Market because flavors, sweeteners, preservatives, colors, emulsifiers, stabilizers, thickeners, enzymes, acidulants, antioxidants and processing aids are embedded into packaged foods, beverages, bakery products, dairy items, snacks, meat products, sauces, frozen meals and foodservice ingredients. U.S. Census Bureau data identifies food manufacturing, NAICS 311, as the largest manufacturing subsector by shipments at USD 904.1 billion, with cost of materials at USD 552.7 billion, showing the industrial base that uses additive systems for taste, shelf life, texture, color and processing performance. USDA ERS reported U.S. consumers spent USD 2.58 trillion on food, up from USD 2.48 trillion, with food-away-from-home spending shifting higher, supporting both retail packaged food and foodservice ingredient use. World Bank data records U.S. GDP at USD 29.18 trillion and population at 340,110,988, reinforcing a very large consumption and manufacturing base. This driver is market specific because additives enable product consistency across high-volume national brands, private labels, co-packers and chain foodservice menus.
Beverage, Foodservice and Clean-Label Reformulation Demand
Beverage innovation, foodservice standardization and clean-label reformulation drive the USA Food Additives Market because manufacturers need flavor systems, sweetener blends, preservatives, natural colors, emulsions, acidulants, stabilizers, texture systems and masking agents to maintain sensory performance while changing labels. USDA ERS reported total U.S. food spending of USD 2.58 trillion, with food-away-from-home spending rising as consumer demand shifted toward restaurants, cafés, QSR chains, delivery food and institutional foodservice. This creates additive demand for standardized taste, shelf life, texture and color across distributed foodservice networks. World Bank data records U.S. GDP per capita at over USD 85,000 and GDP at USD 29.18 trillion, supporting premium beverage launches, functional drinks, protein beverages, reduced-sugar products and reformulated packaged foods. FDA’s Red No. 3 order requires food manufacturers using FD&C Red No. 3 to reformulate by January 15, 2027, adding a regulatory catalyst for natural color systems, stability testing and label redesign. This driver is market specific because additives are the technical bridge between consumer-facing claims and manufacturable food products.
Market Challenges
FDA Chemical Reassessment and Synthetic Color Reformulation Pressure
FDA chemical reassessment is a major challenge for the USA Food Additives Market because food additive suppliers and packaged food companies must manage safety documentation, toxicology review, GRAS support, label changes, color replacement, sensory validation and supply continuity. FDA revoked authorization for FD&C Red No. 3 in food and ingested drugs, giving food manufacturers until January 15, 2027 and ingested-drug manufacturers until January 18, 2028 to reformulate. This directly affects confectionery, bakery products, frozen desserts, beverages, snack coatings, icings and decorated foods that historically used certified synthetic colors. FDA also maintains post-market assessment work for chemicals in the food supply, including food ingredients, additives, color additives, food contact substances and contaminants, increasing scrutiny across additive portfolios. World Bank data records U.S. GDP at USD 29.18 trillion and population at 340,110,988, while USDA ERS reported food spending at USD 2.58 trillion, showing the large number of products and consumers affected by regulatory changes. This challenge is market specific because natural color alternatives can create cost-in-use, heat stability, light stability, pH sensitivity, flavor interaction and shelf-life issues.
Clean-Label Functionality Trade-Offs and Supply Chain Complexity
Clean-label functionality trade-offs restrain the USA Food Additives Market because natural preservatives, plant-derived colors, fermentation-derived ingredients, clean-label starches, citrus fiber, gums, enzymes and natural flavors do not always match the performance of synthetic or conventional systems. Food manufacturers must validate microbiological stability, color retention, flavor release, viscosity, texture, sweetness, pH control, moisture retention and processing tolerance across beverages, bakery, dairy, snacks, meat, sauces, frozen foods and plant-based products. USDA ERS reported U.S. consumers spent USD 2.58 trillion on food, up from USD 2.48 trillion, which indicates a large and diverse downstream system where reformulation failures can affect many SKUs. Census data identifies food manufacturing shipments at USD 904.1 billion and material costs at USD 552.7 billion, showing the scale of formulation inputs moving through plants. World Bank data records U.S. GDP per capita above USD 85,000, supporting premium product development but also raising consumer expectations for clean labels, nutrition claims and sensory quality. The challenge is market specific because additive substitution is not one-for-one; it often requires new processing parameters, supplier qualification, shelf-life testing and regulatory documentation.
Market Opportunities
Natural Colors, Bio-Based Preservatives and Regulatory-Ready Reformulation
Natural colors, bio-based preservatives and regulatory-ready reformulation create a future growth opportunity for the USA Food Additives Market because FDA action and retailer pressure are accelerating the shift away from selected synthetic additives. FDA’s Red No. 3 revocation gives food manufacturers until January 15, 2027 to reformulate, creating immediate demand for alternatives such as beet color, anthocyanins, carotenoids, paprika, turmeric, spirulina, annatto and other natural color systems. FDA also encouraged manufacturers to accelerate phasing out FD&C Red No. 3 ahead of the deadline, reinforcing demand for technical service, stability testing and application-specific replacement systems. USDA ERS reported U.S. food spending at USD 2.58 trillion, and U.S. Census data identifies food manufacturing shipments at USD 904.1 billion, indicating the scale of products potentially affected by additive reformulation. World Bank data records U.S. GDP at USD 29.18 trillion, supporting investment in food R&D, application labs and ingredient innovation. This opportunity is market specific because suppliers can move beyond commodity additives into formulation partnerships, regulatory dossiers, natural color blends, fermentation-derived preservatives and clean-label shelf-life systems.
Sugar Reduction, Texture Optimization and Functional Food Systems
Sugar reduction, texture optimization and functional food systems create a future growth opportunity for the USA Food Additives Market because beverage companies, bakery producers, dairy manufacturers, snack brands, plant-based food companies and nutrition brands require complex additive systems to deliver taste, mouthfeel, stability and claim support. USDA ERS reported food-away-from-home spending at USD 1.41 trillion and total food spending at USD 2.51 trillion in a recent release, while its Food Dollar update reported total food spending at USD 2.58 trillion, confirming a large food ecosystem across retail and foodservice. World Bank data records U.S. GDP at USD 29.18 trillion and population at 340,110,988, supporting continued demand for convenient foods, functional beverages, private-label reformulation and premium health-oriented products. U.S. food manufacturing shipments of USD 904.1 billion show a large industrial base where additives are used to reduce sugar, mask high-intensity sweetener aftertaste, stabilize protein beverages, improve plant-based textures, control moisture in bakery products and extend shelf life in distributed supply chains. This opportunity is market specific because value growth will come from integrated systems rather than single ingredients, including sweetener blends, bulking agents, hydrocolloids, enzymes, emulsifiers, flavors and encapsulated nutrients.
Future Outlook
USA Food Additives Market is expected to grow steadily during the forecast period, supported by packaged food innovation, beverage reformulation, clean-label demand, sugar reduction, sodium reduction, plant-based food texture optimization, shelf-life extension and private-label product development.
Regulatory scrutiny will reshape additive portfolios. FDA has revoked authorization for FD&C Red No. 3 in food and ingested drugs, with food manufacturers required to reformulate by January 15, 2027. This will accelerate demand for natural colors, certified color alternatives, reformulation support and stability testing.
Clean-label reformulation will remain a core growth area. Manufacturers will increasingly replace artificial colors, synthetic preservatives and long ingredient lists with natural colors, cultured ingredients, vinegar systems, fermentation-derived preservatives, citrus fiber, clean-label starches, plant-based stabilizers and enzyme-based processing aids.
Beverage and functional nutrition innovation will increase additive complexity. Reduced-sugar beverages, protein drinks, energy drinks, hydration beverages and fortified products require sweetener blends, acidulants, flavors, maskers, colors, emulsifiers and stabilizers that maintain taste, clarity, mouthfeel and nutrient stability.
Plant-based and alternative dairy products will support demand for hydrocolloids, starches, protein stabilizers, emulsifiers, fat mimics, flavor maskers and natural colors. Texture, taste and stability remain the central technical barriers, making application support and customized ingredient systems important competitive differentiators.
Major Players
- Cargill
- ADM
- International Flavors & Fragrances
- Kerry Group
- Ingredion
- Tate & Lyle
- Corbion
- Givaudan
- DSM-Firmenich
- Sensient Technologies
- Kalsec
- Roquette America
- BASF Nutrition & Health
- Ajinomoto Health & Nutrition North America
- CP Kelco
Key Target Audience
- Food Additive Manufacturers
- Flavor and Fragrance Companies
- Packaged Food Manufacturers
- Beverage Manufacturers
- Bakery, Dairy, Meat and Snack Processors
- Foodservice Ingredient Buyers and Chain Restaurant Procurement Teams
- Investments and Venture Capitalist Firms
- Government and Regulatory Bodies (U.S. Food and Drug Administration, U.S. Department of Agriculture, Federal Trade Commission, Centers for Disease Control and Prevention, California Office of Environmental Health Hazard Assessment)
Research Methodology
Step 1: Identification of Key Variables
The initial phase involves constructing an ecosystem map encompassing all major stakeholders within the USA Food Additives Market. This includes additive manufacturers, flavor houses, ingredient distributors, packaged food companies, beverage companies, co-packers, foodservice chains, application labs, testing providers and regulatory agencies. The objective is to define variables such as additive function, origin, application, regulatory status, form, end user and clean-label positioning.
Step 2: Market Analysis and Construction
In this phase, historical data is compiled and analyzed for the USA Food Additives Market. The assessment covers flavors, sweeteners, preservatives, colors, emulsifiers, stabilizers, thickeners, enzymes, acidulants, antioxidants, processing aids and nutrient additives. Top-down validation uses food expenditure, food manufacturing and regulatory datasets, while bottom-up validation uses application mapping, product-label audits and manufacturer interviews.
Step 3: Hypothesis Validation and Expert Consultation
Market hypotheses are developed and validated through computer-assisted interviews with additive suppliers, flavor houses, food manufacturers, beverage formulators, bakery ingredient buyers, dairy processors, snack producers, meat processors, co-packers and regulatory professionals. These consultations provide operational insights into reformulation triggers, additive selection, cost-in-use, clean-label substitution, supplier qualification and FDA/GRAS documentation.
Step 4: Research Synthesis and Final Output
The final phase integrates desk research, primary interviews, label audits, application benchmarking, regulatory mapping and competitive assessment into a consolidated market model. Supplier inputs are compared with observed product launches, food manufacturing demand, regulatory shifts and clean-label reformulation activity. The final output provides a validated view of market size, segmentation, competition, future outlook and strategic implications.

- Executive Summary
- Research Methodology (Market Definitions and Assumptions, Abbreviations, Food Additive and GRAS Ingredient Classification, Direct vs Indirect Additive Inclusion Criteria, Synthetic vs Natural Ingredient Inclusion Criteria, Clean Label and Conventional Formulation Scope, FDA Food Additive Petition and GRAS Notice Mapping, Food Chemical Safety Review Assessment, Food Manufacturer Demand Mapping, Ingredient Distributor and Formulator Assessment, Market Sizing Approach, Top-Down Analysis, Bottom-Up Analysis, Demand-Side Assessment, Supply-Side Assessment, FDA Ingredient Inventory Validation, Retail Packaged Food Label Audit, Foodservice and Industrial Formulation Interviews, Primary Industry Interviews, Data Triangulation, Forecasting Framework, Limitations and Future Conclusions)

- Definition and Scope
- Market Evolution and Industry Genesis
- Timeline of Major Industry Developments
- Business Cycle and Reformulation Cycle
- Food Additive Regulatory Pathway Analysis

- Growth Drivers (Packaged Food Manufacturing Scale, Beverage Innovation, Clean Label Reformulation, Sugar Reduction and Low-Calorie Product Demand, Shelf-Life Extension Requirements, Flavor System Innovation, Plant-Based Food Formulation, Foodservice Menu Standardization, Private Label Product Development, Functional and Fortified Food Demand)
- Market Challenges (FDA Post-Market Chemical Safety Scrutiny, Red No. 3 Reformulation Requirement, GRAS Transparency Debate, State-Level Additive Restrictions, Consumer Skepticism Toward Artificial Ingredients, Clean Label Cost and Functionality Trade-Offs, Supply Chain Dependence for Specialty Ingredients, Allergen and Labeling Risk, Reformulation Validation Complexity)
- Market Opportunities (Natural Color Replacement, Fermentation-Derived Additives, Bio-Based Preservatives, Clean Label Texturizers, Sugar and Sodium Reduction Systems, Plant-Based Protein Texture Solutions, Enzyme-Based Processing Aids, Encapsulation and Controlled Release Systems, Upcycled Ingredient Platforms, AI-Assisted Flavor and Formulation Development)
- Market Trends (Shift from Artificial to Natural Colors, FDA Food Chemical Reassessment, Clean Label Ingredient Simplification, Natural Flavor System Expansion, Precision Fermentation Ingredients, Functional Beverage Additives, Plant-Based Stabilizer Demand, Texture Optimization in Dairy Alternatives, Label-Friendly Preservative Systems, Customized Ingredient Blends)
- SWOT Analysis
- Porter’s Five Forces Analysis
- PESTLE Analysis

- By Market Value (2020-2025)
- By Volume Consumption (2020-2025)
- By Average Selling Price (2020-2025)

- By Additive Function (In Value %)
Flavors and Flavor Enhancers
Sweeteners
Preservatives
Colors
Emulsifiers
Stabilizers and Thickeners - By Ingredient Origin (In Value %)
Synthetic Additives
Nature-Identical Additives
Natural Additives
Plant-Derived Additives - By Distribution and Sales Channel (In Value %)
Direct Sales to Food Manufacturers
Ingredient Distributors
Specialty Chemical Distributors
Flavor Houses
Foodservice Ingredient Suppliers - By Region (In Value %)
Northeast USA
Midwest USA
South USA
West USA

- Market Share of Major Players (By Value, Volume, Additive Function, Application, Ingredient Origin, Sales Channel)
- Competitive Positioning Matrix (Functionality Breadth, Application Lab Network, Regulatory Support Capability, Clean Label Portfolio, Natural Ingredient Pipeline, Customer Co-Development Capability, Supply Chain Security, Scale of U.S. Manufacturing Footprint)
- Cross Comparison Parameters (Food Additive Portfolio Breadth, FDA and GRAS Regulatory Support Capability, Application Lab and Technical Service Network, Clean Label Reformulation Strength, Natural Colors and Flavors Portfolio, Sweetener and Sugar-Reduction System Capability, Enzyme and Texturizer Innovation Pipeline, U.S. Manufacturing and Distribution Footprint)
- SWOT Analysis of Major Players
- Detailed Profiles of Major Companies
Cargill
ADM
International Flavors & Fragrances
Kerry Group
Ingredion
Tate & Lyle
Corbion
Givaudan
DSM-Firmenich
Sensient Technologies
Kalsec
Roquette America
BASF Nutrition & Health
Ajinomoto Health & Nutrition North America
CP Kelco

- Food Manufacturer Demand Assessment
- Packaged Food Buyer Behavior Assessment
- Beverage Formulation Demand Assessment
- Bakery and Cereal Additive Demand Assessment
- Dairy and Frozen Dessert Additive Demand Assessment

- By Market Value (2026-2035)
- By Volume Consumption (2026-2035)
- By Average Selling Price (2026-2035)


 Request a Sample
 Ask for Customization
 Get a Quote
 Enquire Now