
 Download PDF
 Download PDF
Market Overview
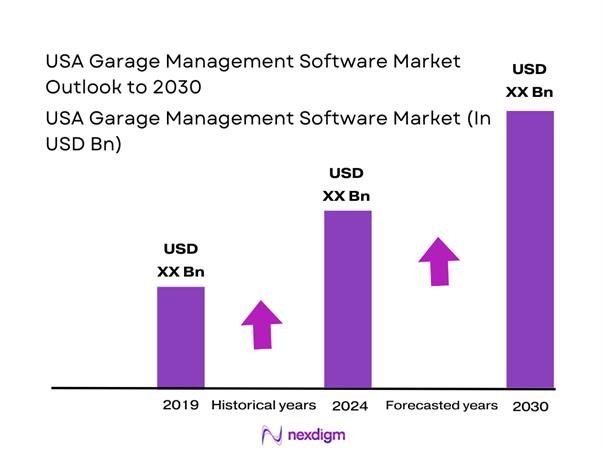
The garage management software market in North America is valued at USD ~ million, reflecting accelerating digitization inside repair workflows (digital inspections, automated estimating, real-time approvals, and integrated payments). Demand is reinforced by a growing maintenance intensity of the vehicle parc: the average age of cars and light trucks is 12.6 years, 2 months higher than 2023 reading, pushing more service events per vehicle and raising the value of scheduling discipline, technician productivity tools, and customer communication automation.
Dominant market centers are the largest U.S. metro repair economies—notably Los Angeles, New York, Chicago, Dallas–Fort Worth, Houston, Atlanta, Phoenix, Miami, Seattle, and the Bay Area—because they combine high vehicle density, large networks of independent repair shops and chains, and stronger willingness to pay for workflow software that reduces cycle-time and increases approvals. The U.S. also leads North America due to deeper SaaS penetration and stronger integration ecosystems (parts catalogs, labor guides, payment rails, SMS, CRM), enabling vendors to scale faster across multi-store operators.
Market Segmentation
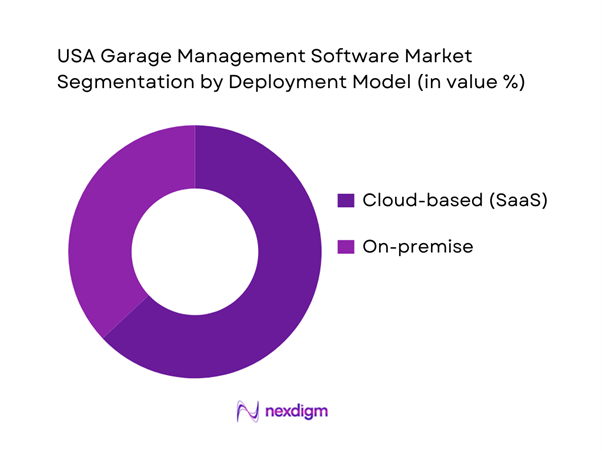
By Deployment Model
Cloud-based platforms dominate because they remove server/IT burdens for small and mid-sized garages while enabling multi-location visibility, automatic updates, mobile-first DVIs, remote approvals, and rapid integration with catalogs, payment providers, and customer messaging. SaaS also supports continuous feature rollout (e.g., AI-assisted estimating prompts, smart parts ordering, and workflow automations) without downtime. In the U.S., operator preferences increasingly favor speed-to-value: same-week implementation, templated workflows, and plug-and-play integrations—advantages that are structurally easier in cloud architectures than in legacy on-premise systems.
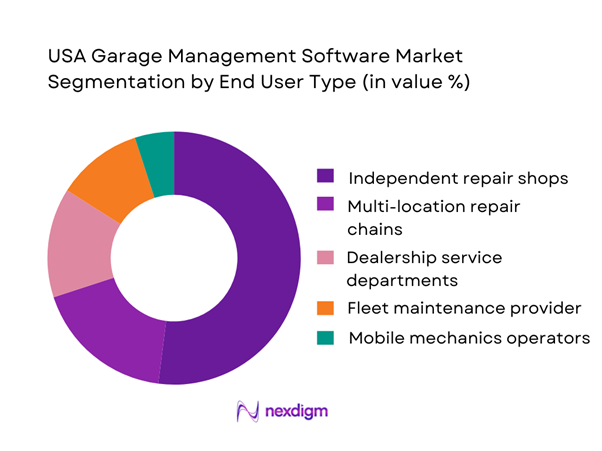
By End User Type
Independent repair shops dominate because the U.S. aftermarket is structurally fragmented, with a very large long-tail of owner-operated garages needing front desk-to-bay workflow control (appointments → inspection → estimate → approval → RO → invoice → payment). These shops see immediate ROI from DVIs (photo/video evidence for trust), automated reminders, faster authorizations, and better technician dispatching—directly improving car count, effective labor utilization, and approval rates. Meanwhile, chains and dealerships adopt more complex stacks, but independents convert faster because SaaS vendors package onboarding, templates, and integrations designed for quick wins in daily operations.
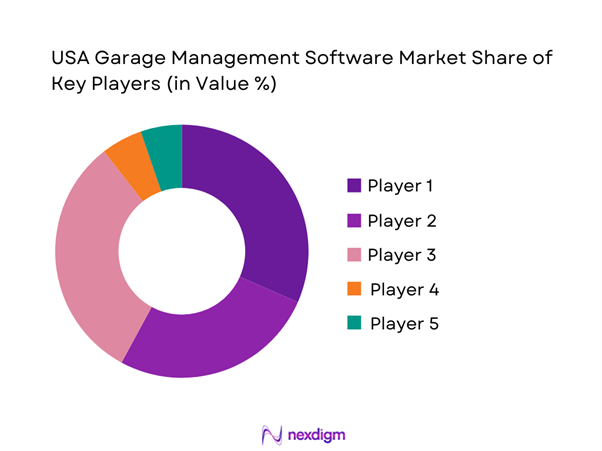
Competitive Landscape
The U.S. garage management software space is competitive but increasingly platform-led: vendors differentiate on DVI experience, estimating speed, parts & catalog integrations, payments, reporting, and multi-location controls. Consolidation is visible through private equity and strategic rollups (buy-and-build around workflow + payments + customer experience), while mid-market leaders compete by expanding feature depth and integration breadth.
| Company | Established | Headquarters | Primary Customer Fit | Core Workflow Strength | DVI & Media | Integrations Focus | Payments/Fintech Layer | Multi-Location Controls | Implementation Style |
| Tekmetric | 2017 | Houston, Texas | ~ | ~ | ~ | ~ | ~ | ~ | ~ |
| Shopmonkey | 2017 | California (U.S.) | ~ | ~ | ~ | ~ | ~ | ~ | ~ |
| Mitchell 1 | 1918 | California (U.S.) | ~ | ~ | ~ | ~ | ~ | ~ | ~ |
| Shop-Ware | 2013 | San Francisco, California | ~ | ~ | ~ | ~ | ~ | ~ | ~ |
| AutoLeap | 2019 | Toronto, Ontario | ~ | ~ | ~ | ~ | ~ | ~ | ~ |
USA Garage Management Software Market Analysis
Growth Drivers
Aging vehicle parc pull-through
The average age of light vehicles in the U.S. reached 12.6 years (up from 12.4 years), expanding the pool of out-of-warranty vehicles that require higher-frequency maintenance, diagnostics, and repair documentation—directly increasing repair orders that must be estimated, authorized, billed, and recorded inside garage management systems. On the demand side, the U.S. economy generated USD ~ trillion in output and USD ~ GDP per capita, supporting continued vehicle usage even as operating costs rise. At the same time, consumers spent USD ~ billion on motor vehicle maintenance and repair services, up from USD ~ billion, which increases the operational load on shops (RO volume, parts lines per RO, labor ops, sublet tracking) and pushes adoption of workflow software to manage throughput with auditability and faster cycle times.
DIFM dominance
A clear proxy for “Do-It-For-Me” intensity is the scale of paid service consumption: U.S. personal consumption expenditures for motor vehicle maintenance and repair were USD ~ billion (up from USD ~ billion and USD ~ billion), indicating large, recurring paid workloads flowing through professional bays rather than home garages. This spending level—paired with a USD ~ trillion economy—supports dense networks of independent shops, tire chains, and service centers that run multi-bay operations needing standardized estimating, parts sourcing, technician dispatch, customer communications, and compliance recordkeeping. As service complexity grows (ADAS calibration steps, scan-tool documentation, warranty coding, and digital customer approvals), DIFM behavior translates into higher RO complexity (more line items, more authorization events, more payment events). Garage management platforms become the operating system that prevents write-offs and leakage while keeping RO lifecycle data complete for audits, disputes, and repeat-visit conversion.
Challenges
Workflow change resistance
Many shops run on “muscle memory” built around paper tickets, whiteboards, and informal role splitting; digitization can be perceived as slowing the lane—especially when service prices are already rising. The CPI index for motor vehicle maintenance and repair moving from ~ to ~ signals customers are paying more for the same visit types, which heightens friction when process changes cause delays at intake or delivery. At the same time, U.S. consumers’ average annual expenditures rose to USD ~ (from USD ~), indicating households are still spending—but will push back on poor experience. In this environment, resistance is not just cultural; it’s economic: service advisors fear throughput loss during transition, and owners fear repeat-customer erosion if check-in/estimate feels slower. Effective adoption therefore requires software that mirrors shop language (RO, labor ops, parts matrix), supports gradual rollout (digital inspections first, then authorizations, then inventory/payments), and provides manager dashboards that prove cycle-time improvement without disrupting bay flow.
Training overhead
Training time has a real opportunity cost when bays are full and staff is scarce. Persistent technician openings mean shops are frequently onboarding replacements and apprentices—exactly when they least want to add software training burden. Wage structure also reinforces the issue: automotive technician wage distributions make retention and upskilling expensive, so owners want tools that “train themselves” through workflow guidance rather than classroom time. Macro pressure amplifies this: with the U.S. producing USD ~ trillion output and inflation at ~, demand stays resilient, but downtime remains costly. Garage software that requires long onboarding (complex permissions, non-intuitive parts mapping, fragile integrations) raises training overhead and slows adoption. The practical requirement is software that is role-based (service writer vs tech vs cashier), mobile-friendly on the shop floor, and template-driven (inspections, labor packages, canned jobs) so new hires can execute standardized work quickly while management captures consistent RO data for invoicing and comebacks.
Opportunities
AI-assisted estimating and service recommendations
AI value in garage workflows is less about “future hype” and more about current operational math: consumers already spend USD ~ billion on maintenance and repair services, and the service price basket has moved to ~ on the CPI index—meaning estimate accuracy, authorization speed, and clear recommendations materially affect conversion and rework today. AI-assisted estimating can use structured RO history (labor ops, parts lines, vehicle profile) to pre-fill likely jobs, flag missing line items, and standardize inspection narratives—helping advisors handle more tickets without sacrificing documentation quality. The payments environment supports this too: consumers make ~ payments per month and increasingly transact by card and online methods, so AI-driven digital approvals combined with pay-by-link reduces time-to-authorization and time-to-cash without changing pricing. With U.S. GDP at USD ~ trillion, multi-location groups can justify workflow standardization; AI features that reduce variance across advisors/locations become a direct lever for scaling service quality and throughput while keeping RO records consistent for disputes and warranty evidence.
Unified parts-to-RO automation
Unifying parts discovery → availability → ordering → receiving → posting → warranty/returns into the RO record is a “now” opportunity because the underlying parts ecosystem is already massive and complex. U.S. imports of automotive vehicles, parts, and engines reached USD ~ billion, indicating a deep dependence on high-variety components that must be sourced reliably and reconciled accurately at the shop level. Meanwhile, consumers spent USD ~ billion on maintenance and repair services, meaning even small parts-related delays have large throughput implications across the national service base. As vehicles age to 12.6 years, fitment errors and supersession issues increase, raising return loops and advisor time. A unified parts-to-RO layer (VIN decode, supplier connectors, smart substitutions, automated posting, core tracking, return labels, and warranty notes) reduces “parts friction” without needing any future demand assumptions. In a USD ~ GDP-per-capita economy where customers expect digital transparency, automation that links every part event to the RO improves cycle time, reduces disputes, and strengthens repeat-service conversion.
Future Outlook
Over the next planning cycle, the USA Garage Management Software Market is expected to expand as repair operators prioritize throughput, technician productivity, and customer trust in an environment of higher vehicle complexity (ADAS, EV service workflows, scan-and-calibrate requirements). Software will continue shifting from “operations support” to revenue infrastructure, bundling payments, financing offers, retention marketing, parts procurement intelligence, and KPI coaching into one platform. Globally, the auto repair software category is projected to grow from USD ~ billion to USD ~ billion, reflecting a CAGR of ~.
Major Players
- Tekmetric
- Shopmonkey
- Mitchell 1
- Shop-Ware
- AutoLeap
- R.O. Writer
- GEM-CAR
- AutoFluent
- RO Writer / Progressive Automotive Systems
- Identifix
- ALLDATA
- CCC Intelligent Solutions
- ARI
- Fleetio
Key Target Audience
- Independent auto repair shop owners & general managers
- Multi-location repair chains and franchise operators
- Dealership group fixed-ops leadership
- Fleet operators and fleet maintenance management teams
- Parts distributors / aftermarket networks building digital enablement programs
- Investments and venture capitalist firms
- Government and regulatory bodies
- Insurance and warranty administrators
Research Methodology
Step 1: Identification of Key Variables
We construct an ecosystem map of U.S. garage operations and software stakeholders (shops, chains, fleets, parts distributors, payment providers, data vendors). Desk research compiles variables such as RO volume drivers, labor utilization, DVI adoption, and integration dependencies. The objective is to define the factors that most directly influence purchase decisions and renewal behavior.
Step 2: Market Analysis and Construction
We analyze historical adoption patterns and buyer cohorts by shop size (single site vs. multi-store), service mix (general repair, diagnostics-heavy, tire-focused), and workflow maturity (paper → hybrid → fully digital). Revenue build-up is constructed via seat/license proxies, transaction layers (payments), and add-on module penetration across operator tiers.
Step 3: Hypothesis Validation and Expert Consultation
Hypotheses are validated through structured interviews (CATI/VCI) with shop owners, service advisors, multi-store operators, and vendor/channel partners. These discussions refine pricing packaging logic, implementation friction points, and the impact of integrations (parts catalogs, labor guides, accounting, SMS) on retention and expansion.
Step 4: Research Synthesis and Final Output
We synthesize findings using triangulation across vendor disclosures, credible market benchmarks, and operator interviews. Output is stress-tested via scenario checks (macro repair demand, technician availability, EV/ADAS service complexity) to ensure conclusions hold across different service models and geographies within the U.S.
- Executive Summary
- Research Methodology (Market Definitions and Assumptions, Abbreviations, Scope Boundary: “Garage/Shop Management Software” vs DMS/Collision/Fleet, Inclusion–Exclusion Criteria, Data Triangulation Framework, Market Sizing Approach, Bottom-Up Revenue Build (shop count × paid seats × ARPU), Top-Down Spend Proxy (auto care digital ops spend), Primary Research Approach (shop owners, MSOs, franchise groups, distributors, parts networks, payment providers), Voice-of-Customer Interviews, Vendor Briefings, Pricing & Packaging Capture, Data Validation and Cross-Checks, Limitations and Analyst Notes)
- Definition and Scope
- Market Genesis and Evolution
- Industry Context Snapshot
- Ecosystem and Value Chain
- Stakeholder Map
- Technology Stack Landscape

- Growth Drivers
Aging vehicle parc pull-through
DIFM dominance
Bay productivity pressure
Technician scarcity
Payment acceleration - Challenges
Workflow change resistance
Training overhead
Data migration from legacy RO systems
Integration fragmentation
Parts catalog accuracy - Opportunities
AI-assisted estimating and service recommendations
Unified parts-to-RO automation
Embedded lending and BNPL for repairs
Enterprise rollups and MSO platforms
ADAS workflow templates - Trends
Mobile-first DVIs
Two-way texting
Photo and video evidence
Real-time parts availability
Digital payment links - Regulatory & Policy Landscape
- SWOT Analysis
- Stakeholder & Ecosystem Analysis
- Porter’s Five Forces Analysis
- Competitive Intensity & Ecosystem Mapping
- By Value, 2019–2024
- Installed Base, 2019–2024
- Service Revenue Mix, 2019–2024
- By Fleet Type (in Value %)
Independent Single-Location Shops
Independent Multi-Location Shops
Franchise Networks
MSOs
Dealership Service Lane Add-on Use - By Application (in Value %)
General Repair
Tire & Service
Quick Lube
Specialty Repair
Detailing and Calibration - By Technology Architecture (in Value %)
Cloud/SaaS
Hybrid
On-Premise
Offline-First Mobile - By Connectivity Type (in Value %)
Integrated Parts Procurement
Labor and Repair Content
Vehicle Data and History
Accounting and Back-Office
Payments and Fintech - By End-Use Industry (in Value %)
Automotive Repair and Maintenance
Fleet Servicing
Specialty Automotive Services
Aftermarket Service Networks - By Region (in Value %)
Northeast
Midwest
South
West
- Competitive Positioning Matrix
- Cross Comparison Parameters (DVI depth and mobile UX, parts procurement coverage and two-way ordering, labor and repair data integration readiness, payments capability, multi-location and role controls, advisor and technician productivity tooling, API and marketplace ecosystem, implementation speed and support SLA)
- Strategic Moves and Recent Developments
- Competitive Moats
- Detailed Profiles of Major Companies
Tekmetric
Shop-Ware
Shopmonkey
AutoLeap
Mitchell 1 Manager SE
NAPA TRACS
R.O. Writer
AutoFluent
Omnique
Protractor
ARI (uMob)
AutoRepair Cloud (InterTAD)
Shop Boss
Winworks
ServiceShop
- Buyer Personas and Decision Units
- Needs, Pain Points and Jobs-to-be-Done
- Adoption Readiness and Change Management
- Buying Journey
- Implementation and Migration Playbooks
- By Value, 2025–2030
- Installed Base, 2025–2030
- Service Revenue Mix, 2025–2030


 Request a Sample
 Ask for Customization
 Get a Quote
 Enquire Now