
 Download PDF
 Download PDF
Market Overview
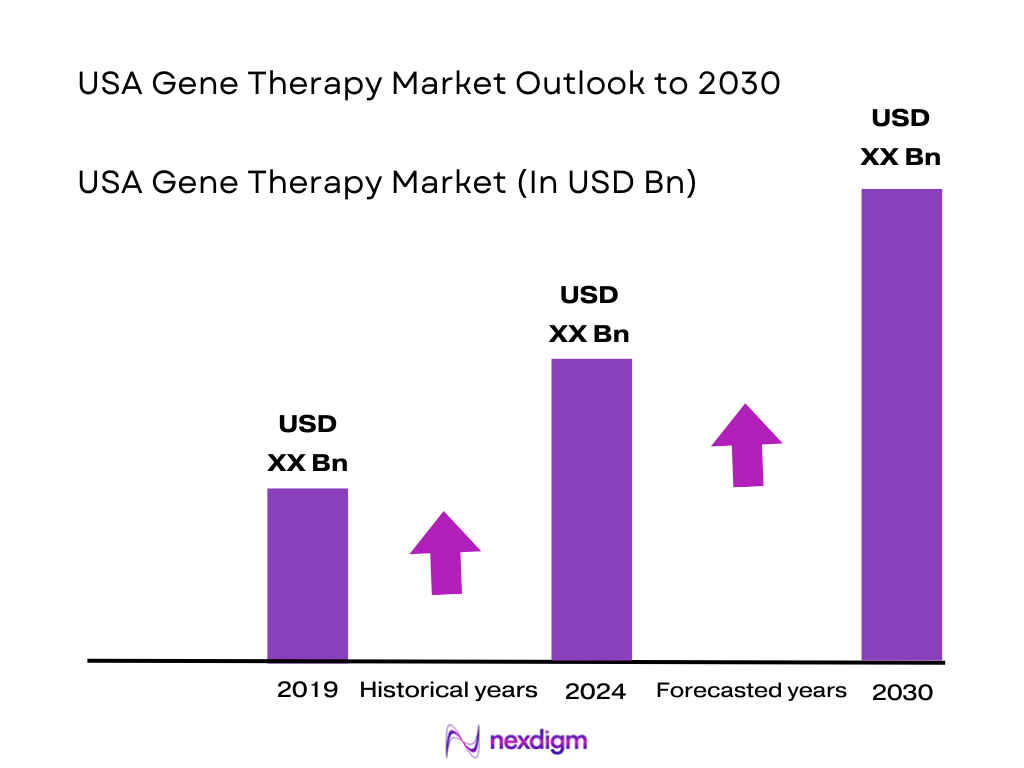
The USA gene therapy market is valued at about USD ~ billion, based on recent historical analysis indicating an expansion from roughly USD ~ billion as more therapies transition from trials to commercialization. Growth is powered by rising approvals of one-time, high-value treatments, increasing diagnosis of rare genetic diseases, and payer willingness to experiment with outcomes-based contracts. Industry assessments suggest the market could more than double over the next decade as additional indications in oncology, hematology, neurology, and ophthalmology move into routine clinical use.
Within the USA gene therapy market, dominance is concentrated in a few biopharma and innovation clusters such as Greater Boston, the San Francisco Bay Area, San Diego, and the Philadelphia–New Jersey and North Carolina Research Triangle corridors. Greater Boston alone hosts nearly 1,000 biotech companies and over 102,000 life-science professionals, underpinning dense clinical, manufacturing, and translational ecosystems. These hubs attract the majority of gene therapy developers, clinical trials, and capital, reinforcing their leadership in discovery, scale-up, and commercial launches.
Market Segmentation
By Therapeutic Area
The USA gene therapy market is segmented by therapeutic area into oncology, hematology, neurology and neuromuscular disorders, ophthalmology, and rare metabolic, immunologic and other genetic diseases. Oncology currently holds a dominant share because most approved and late-stage pipeline products target neoplasms, including multiple CAR-T cell therapies for lymphomas and myeloma and new programs for solid tumors. Analyses of global clinical trials show neoplasms as the leading therapeutic area for cell and gene therapy research, with blood and lymph conditions also heavily represented, reinforcing oncology’s first-mover advantage in commercial uptake and reimbursement.

By Vector Type
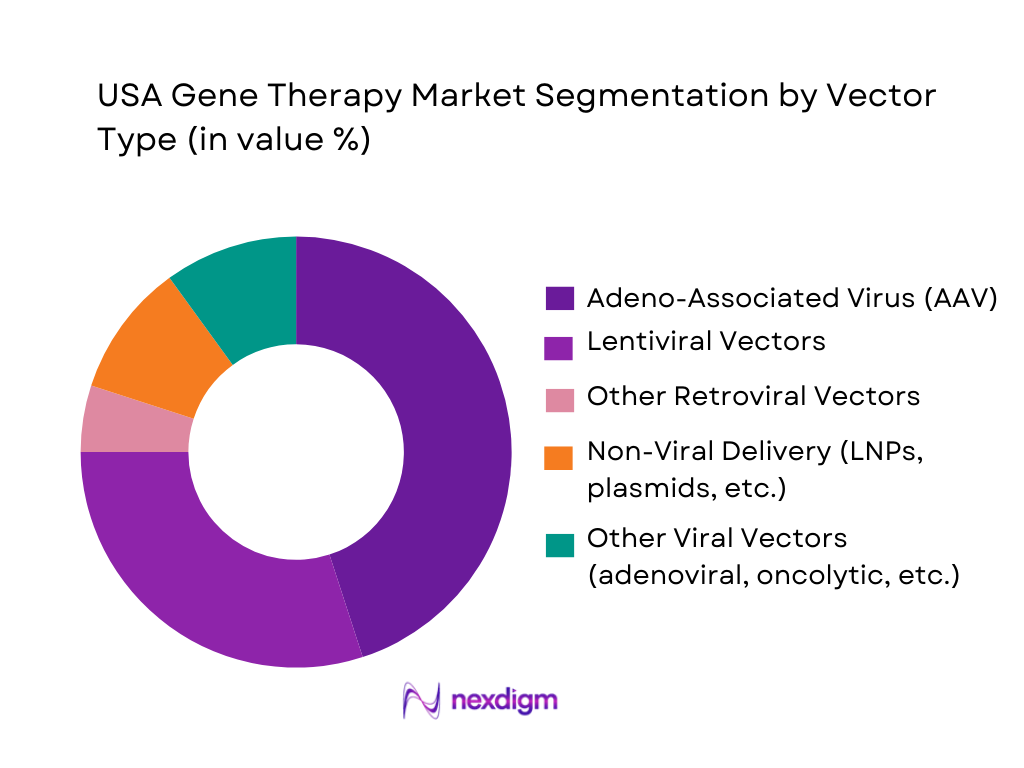
The USA gene therapy market is segmented by vector type into adeno-associated virus (AAV), lentiviral vectors, other retroviral vectors, non-viral delivery systems, and other viral platforms. AAV vectors dominate due to their central role in most approved in vivo gene replacement therapies for conditions such as spinal muscular atrophy and hemophilia A, where single-dose AAV products have received FDA approval. Reviews of the global market indicate viral vectors account for over four-fifths of gene therapy revenue, with AAV and lentiviral vectors particularly favored for their stable gene expression and established manufacturing processes, giving AAV the largest revenue contribution in the USA.
Competitive Landscape
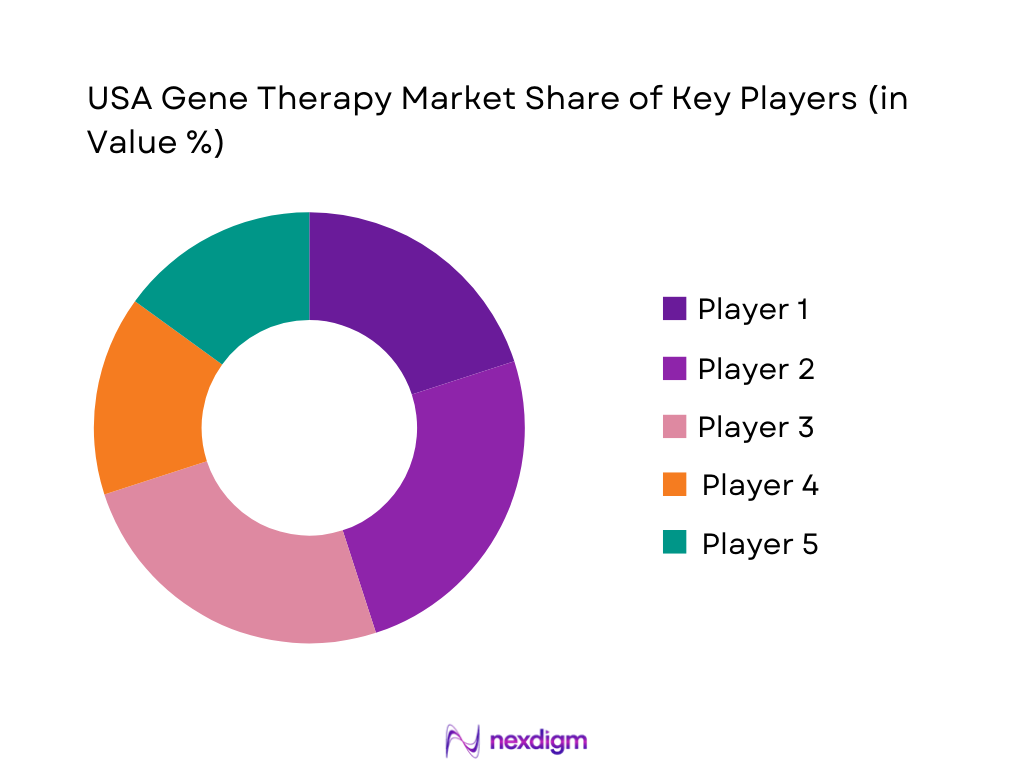
The USA gene therapy market is characterized by a concentrated group of large biopharma companies and specialized gene therapy developers that control most approved products and late-stage assets. A relatively small number of sponsors hold FDA approvals for transformative therapies in spinal muscular atrophy, hemophilia, sickle cell disease, inherited retinal dystrophies, and hematologic malignancies, alongside multiple CAR-T platforms. At the same time, hundreds of smaller clinical-stage companies and academic consortia contribute to a broad pipeline, with more than 3,200 global advanced therapy trials and dozens of new US approvals expected over the coming decade.
| Company | Establishment Year | Headquarters (USA) | Lead Gene Therapy Focus in USA | Flagship Approved / Late-Stage Gene Therapy | Primary Vector / Modality | Core Indications Addressed in USA | U.S. Manufacturing / CMC Footprint | Notable Strategic Strength in Gene Therapy |
| Novartis | 1996 (current form) | East Hanover, New Jersey | ~ | ~ | ~ | ~ | ~ | ~ |
| Gilead Sciences / Kite | 1987 / 2009 | Foster City, California / Santa Monica, California | ~ | ~ | ~ | ~ | ~ | ~ |
| Bristol Myers Squibb | 1887 | Princeton, New Jersey | ~ | ~ | ~ | ~ | ~ | ~ |
| bluebird bio | 1992 | Somerville, Massachusetts | ~ | ~ | ~ | ~ | ~ | ~ |
| BioMarin Pharmaceutical | 1997 | San Rafael, California | ~ | ~ | ~ | ~ | ~ | ~ |
USA Gene Therapy Market Analysis
Growth Drivers
Genetic Disease Burden & Unmet Need
The USA gene therapy market is fundamentally driven by the scale of rare and inherited disease burden. Federal estimates indicate that more than 30 million people in the United States live with one of roughly 10,000 rare diseases, yet fewer than 600 of these conditions currently have any FDA-approved treatment, leaving well over 29 million patients without a targeted therapy option. At the same time, current health expenditure in the United States reached about USD ~ trillion with per-capita spending around USD 12,434, underscoring the economic weight of chronic, poorly treated disease on the system. This combination of millions of genetically driven conditions and limited approved interventions creates a structurally large, medically urgent and economically visible demand pool for one-time or highly durable gene therapies.
Diagnostic Yield & Newborn Screening Expansion
Gene therapy demand is amplified by systematic improvements in genetic diagnosis and newborn screening coverage. Around ~ million births were recorded in the United States in the most recent year of finalized data, and federal programs report that nearly all of the roughly 4 million newborns delivered annually undergo standardized screening panels, with participation rates reported at 99.9% in many states. Each year, about 12,500 newborns are diagnosed with one of the core screened conditions, meaning close to one in every 300 screened infants has a serious disorder detectable at birth. As the national population has climbed above 340 million people and demographic growth accelerates again after the pandemic, this combination of universal neonatal screening and a large birth cohort is steadily growing the pool of genetically characterized patients who are eligible for curative or disease-modifying gene therapies early in life.
Market Challenges
High Upfront Budget Impact
Despite macro-level spending power, financing one-time or highly durable gene therapies creates acute budget-impact stress for US payers. Health care consumes about USD ~ trillion annually, yet that total must cover 340 million residents whose population is growing by roughly ~ million people per year. Retail prescription drugs already account for USD ~ billion of that spend, with double-digit growth driven by complex biologics in areas such as oncology and metabolic disease. Against this backdrop, state Medicaid plans, Medicare, commercial insurers and self-insured employers must accommodate therapies that shift decades of care into a single intervention while also funding ongoing chronic treatments. The result is an environment where innovative payment models are needed, but actuarial, accounting and regulatory rules often lag behind the economics of curative gene therapies, delaying coverage decisions and constraining near-term uptake even when long-term value is compelling.
Complex Care Pathways & Referral Networks
The delivery architecture for gene therapy in the United States is intricate and uneven. There are around 6,093 hospitals nationwide, but only a subset operate as comprehensive hubs capable of leukapheresis, vector handling, intensive monitoring and long-term follow-up appropriate for advanced gene therapies. Within oncology alone, just 73 centers hold an NCI-Designated Cancer Center status out of an estimated 1,500 cancer centers, highlighting how cutting-edge capabilities are concentrated in a small fraction of institutions. Rare disease care is similarly centralized, with 30 million Americans affected but relatively few multidisciplinary centers for conditions such as hemoglobinopathies or inherited neurologic disorders. This concentration forces many patients to travel long distances and navigate multi-layer referral pathways from community providers to academic hubs, prolonging time to treatment and limiting practical access even when therapies are technically approved and reimbursed.
Opportunities
New Indications & Line Extensions
The single largest opportunity for the USA gene therapy market lies in expanding indications across the vast landscape of genetically driven diseases. NIH and FDA communications estimate more than 10,000 rare diseases worldwide, with over 30 million Americans affected and only about 5% of these conditions having any FDA-approved treatment. Fewer than 600 rare diseases currently have a sanctioned therapy, leaving thousands of monogenic disorders without targeted options. On the oncology side, cancer statistics project roughly 2,001,140 new cancer cases in a single year in the United States, with more than 611,000 deaths, highlighting large incident and prevalent pools for cell- and vector-based gene therapies. When combined with an annual national health spend of USD 4.9 trillion and a population that has surpassed 340 million residents, the clinical and economic headroom for adding new gene therapy labels and line extensions—across hematology, neurology, ophthalmology and oncology—is substantial, especially as existing platforms are adapted to multiple in-class targets.
Re-Administration and Retreatment
Although many gene therapies are designed as one-time interventions, current epidemiology points to significant retreatment potential as durability data mature and new mechanisms emerge. Sickle cell disease alone affects about 100,000 people in the United States, and hemophilia is estimated to impact between 30,000 and 33,000 males nationally, with surveillance studies documenting prevalence rates that vary widely across regions. In oncology, around 2 million new cancer cases are expected in a single year, and relapse or progression is common in aggressive hematologic malignancies where gene-modified cell therapies are already in use. These chronic and relapsing populations sit within a health system serving 340 million residents and spending more than USD 12,000 per person on healthcare annually, indicating a deep reservoir of clinical and financial need for strategies that allow safe re-administration, sequencing with small-molecule or antibody therapies, or transition to second-generation gene products. As durability profiles become clearer, retreatment niches in hemoglobinopathies, bleeding disorders and malignancies can materially enlarge cumulative demand beyond the initial “one-and-done” cohorts.
Future Outlook
Over the next six years, the USA gene therapy market is expected to expand rapidly as more products gain approval across oncology, hematology, neurology, ophthalmology, and metabolic diseases. Industry forecasts indicate the market could grow at a compound annual rate of about 19, leading to roughly a three-fold increase in revenue by the end of the decade, supported by a pipeline of more than 500 gene therapy candidates and increasingly supportive regulatory pathways.
Commercial success will depend on resolving long-term durability questions, optimizing safety profiles, and addressing payer concerns about up-front budget impact. Innovative contracting, including outcomes-based annuity payments and reinsurance pooling, is likely to mature as high-cost one-time therapies become more common. At the same time, manufacturing scale-up—especially for viral vectors and autologous cell therapies—will shape supply reliability and margins, with US-based CDMOs and integrated biomanufacturing networks playing a major enabling role.
Major Players
- Astellas Pharma
- BioMarin Pharmaceutical
- bluebird bio
- CSL Behring
- CRISPR Therapeutics
- Gilead Sciences / Kite Pharma
- Johnson & Johnson
- Novartis
- Orchard Therapeutics
- Pfizer
- Regenxbio
- Roche / Spark Therapeutics
- Sarepta Therapeutics
- UniQure
Key Target Audience
- Biopharmaceutical manufacturers and gene therapy developers
- Contract development and manufacturing organizations
- Hospital systems, transplant centers, and specialty treatment networks
- Health insurers and pharmacy benefit managers
- Investments and venture capitalist firms
- Government and regulatory bodies
- Rare disease and patient advocacy foundations
- Integrated delivery networks and group purchasing organizations
Research Methodology
Step 1: Identification of Key Variables
The first step involved mapping the USA gene therapy ecosystem across sponsors, CDMOs, treatment centers, regulators, payers, and patient organizations. This was supported by extensive desk research using regulatory databases, clinical trial registries, and syndicated advanced-therapy reports to define variables such as therapy type, vector class, indication, patient volume, pricing archetype, and approval status. These variables frame demand drivers, addressable populations, and revenue pools across indications and delivery models.
Step 2: Market Analysis and Construction
A combined top-down and bottom-up approach was applied to construct the USA gene therapy market. At the top-down level, national market estimates from established industry sources were calibrated against global gene therapy and broader cell-and-gene spending benchmarks. At the bottom-up level, product-level data on approved therapies, expected treatment volumes, and center capacity were aggregated by indication and vector type. This dual approach ensured alignment between macro-level spending, pipeline potential, and realistic uptake patterns.
Step 3: Hypothesis Validation and Expert Consultation
Analytical hypotheses on adoption curves, indication prioritization, and payer response were validated through structured interviews and targeted discussions with clinicians, payers, manufacturers, and supply-chain experts active in the USA gene therapy market. These engagements provided insight on topics such as patient funnel attrition, real-world durability, adverse-event management costs, and operational constraints at treatment centers. Feedback was used to refine uptake assumptions, segment-level shares, and the relative weighting of in vivo versus ex vivo modalities.
Step 4: Research Synthesis and Final Output
The final step integrated quantitative modeling with qualitative insights to produce a coherent, forecastable view of the USA gene therapy market through 2030. Scenario analysis was employed to reflect uncertainties around approval volume, safety events, manufacturing reliability, and policy shifts. The resulting market view includes base-case, upside, and downside trajectories, supported by transparent assumptions on indication sequencing, vector-technology evolution, and reimbursement frameworks, ensuring the report can be used as a decision tool by investors, manufacturers, and healthcare providers.
- Executive Summary
- Research Methodology (Market Definition & Taxonomy by Therapy Modality, Inclusion/Exclusion Criteria for Gene Therapies, Data Triangulation Across Regulatory Filings & Clinical Trials, Bottom-Up Therapy/Indication-Level Sizing, Top-Down Macroeconomic & Healthcare Spend Normalization, Primary Expert Interview Framework, Assumptions on Treatment Uptake & Durability, Scenario-Building for High/Base/Low Adoption)
- Definition and Scope of Gene Therapy in the USA
- Evolution of the Gene Therapy Landscape and Key Milestones
- Positioning of Gene Therapy Within the Broader Cell & Advanced Therapies Space
- End-to-End Value Chain and Ecosystem Mapping
- Business Model Archetypes

- Growth Drivers
Genetic Disease Burden & Unmet Need
Diagnostic Yield & Newborn Screening Expansion
Regulatory Support & Designations
Advancements in Vector Engineering
Manufacturing Scale-Up Trajectory - Market Challenges
High Upfront Budget Impact
Complex Care Pathways & Referral Networks
Manufacturing Cost & Yield Constraints
Long-Term Safety & Durability Uncertainty
Operational Readiness at Treatment Centers - Opportunities
New Indications & Line Extensions
Re-Administration and Retreatment
Expansion into Earlier Lines of Therapy
Co-Development with Companion Diagnostics
CDMO Capacity Expansion - Trends
Shift Toward In Vivo Editing & Gene Regulation
Next-Generation Vectors & Capsid Engineering
Allogeneic & Off-the-Shelf Cell-Based Gene Therapies
Platform Approvals & Modular Manufacturing
Digital-Enabled Patient Identification & Monitoring - Regulatory and Policy Landscape
FDA Review Pathways for Gene Therapies
Expedited Designations & Advisory Committee Trends
Post-Marketing Commitments & Long-Term Follow-Up Requirements
Safety Monitoring & REMS Programs - Intellectual Property and Licensing Environment
- Stakeholder Ecosystem Mapping
- Porter’s Five Forces Analysis
- Pricing, Health Economics, and Access Analysis
- By Value, 2019-2024
- By Treated Patient Numbers, 2019-2024
- By Approved Gene Therapy Count and Indication Coverage, 2019-2024
- By Therapy Modality, 2019-2024
- By Payer Type and Funding Source, 2019-2024
- By Therapy Modality (in Value %)
In Vivo Gene Therapy (Systemic & Local Delivery)
Ex Vivo Gene Therapy (Autologous & Allogeneic Cell-Based) - By Vector / Delivery Platform (in Value %)
Adeno-Associated Viral (AAV) Vectors
Lentiviral Vectors
Retroviral Vectors
Adenoviral & Oncolytic Viral Vectors
Non-Viral Delivery - By Therapeutic Area & Indication Cluster (in Value %)
Oncology
Hematology
Neurology & Neuromuscular Disorders
Ophthalmology & Inherited Retinal Disorders
Metabolic, Hepatic, and Endocrine Disorders - By Route of Administration (in Value %)
Intravenous Systemic Infusion
Intrathecal / Intraventricular Central Nervous System Delivery
Subretinal / Intraocular Administration
Intramuscular / Local Tissue Injection
Topical / Localized Surface Application - By End User / Site of Care (in Value %)
Academic Medical Centers and NCI-Designated Cancer Centers
Large Integrated Delivery Networks and Tertiary Hospitals
Specialized Gene & Cell Therapy Centers of Excellence
Standalone Specialty Clinics and Physician Groups
Outpatient Infusion Centers and Ambulatory Surgical Settings - By Payer Type and Access Model (in Value %)
Commercial Payers and Employer-Sponsored Health Plans
Medicare
Medicaid & State Programs
Integrated PBMs and Specialty Pharmacies
Risk Pools, Reinsurance & Innovative Financing Vehicles
- Market Share of Major Players
- Cross Comparison Parameters for Leading Players (USA-Approved Gene Therapy Portfolio and Indication Breadth, Late-Stage Pipeline Assets with USA Focus, Viral Vector and Platform Breadth Including AAV Serotypes & Editing Technologies, USA cGMP Manufacturing Footprint and Vector Capacity, Strategic Partnerships with Academic Centers & CDMOs, Pricing & Access Strategies Including Outcomes-Based Contracts, Commercial Footprint Across Certified Treatment Centers, Real-World Evidence Generation and Long-Term Follow-Up Registries)
- Competitive Strategy and Strategic Moves
- SWOT Analysis of Major Players
- Detailed Company Profiles of Major Market Participants
Novartis
Gilead Sciences / Kite Pharma
BioMarin Pharmaceutical
Sarepta Therapeutics
Spark Therapeutics
Krystal Biotech
Vertex Pharmaceuticals / CRISPR Therapeutics
Legend Biotech and Partnered Pharma
CSL Behring
PTC Therapeutics
Abeona Therapeutics
uniQure
Pfizer
- Academic Medical Centers and Research-Intensive Hospitals
- Integrated Delivery Networks and Large Hospital Systems
- Specialty Clinics and Centers of Excellence for Gene & Cell Therapy
- Payers, PBMs, and Risk-Bearing Organizations
- Patient and Caregiver Perspective
- By Value, 2025-2030
- By Treated Patient Numbers, 2025-2030
- By Approved Gene Therapy Count and Indication Coverage, 2025-2030
- By Therapy Modality, 2025-2030
- By Payer Type and Funding Source, 2025-2030


 Request a Sample
 Ask for Customization
 Get a Quote
 Enquire Now