
 Download PDF
 Download PDF
Market overview
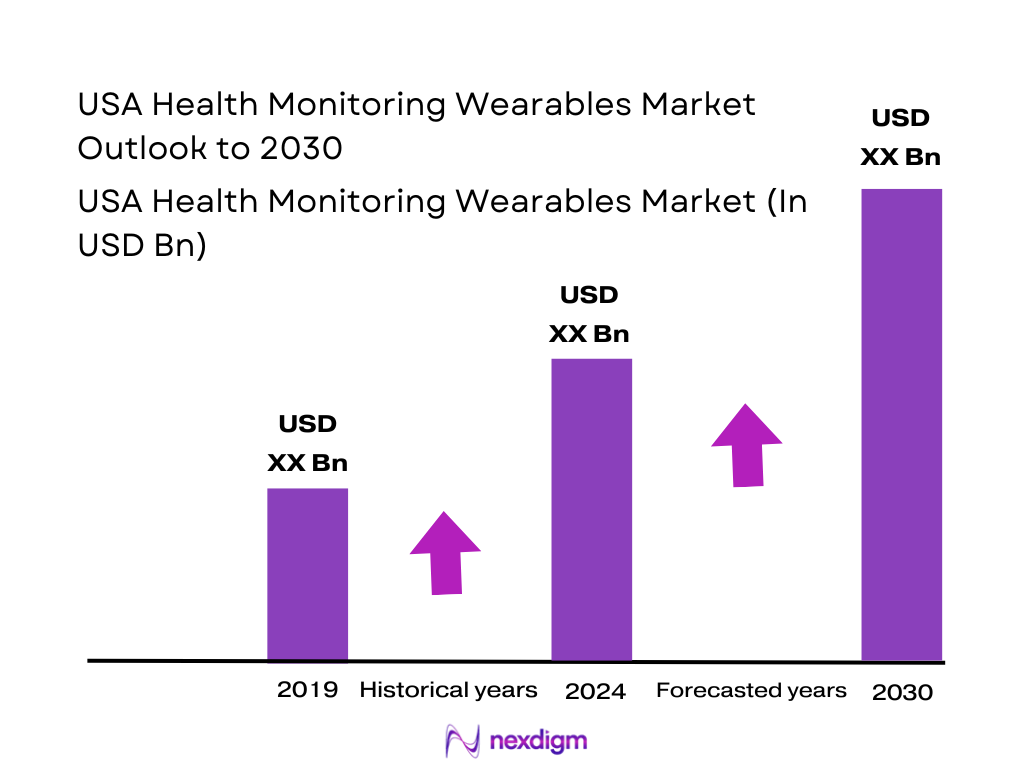
The U.S. health monitoring wearables market is valued at USD ~ billion, up from USD ~ billion in the preceding year, reflecting a rapid scale-up in devices that continuously capture real-time biometric data and integrate it into consumer apps and clinical workflows. Growth is being pulled by rising chronic disease burden, expanding remote monitoring adoption, and ongoing sensor + algorithm upgrades across smartwatches, CGMs, and clinical wearables that reduce friction for patients and providers.
Within the U.S., market leadership is concentrated in innovation and healthcare delivery hubs rather than “share-by-state” dominance. The San Francisco Bay Area anchors consumer wearables ecosystems (hardware/software platforms and developer networks), Seattle supports large-scale cloud and digital health infrastructure, Boston/Cambridge drives clinical validation and medtech partnerships, and Southern California (San Diego/Orange County) is influential in biosensing wearables—especially glucose monitoring. These hubs lead because they combine OEM and startup density, top health systems, research institutions, and faster commercialization pathways.
Market segmentation
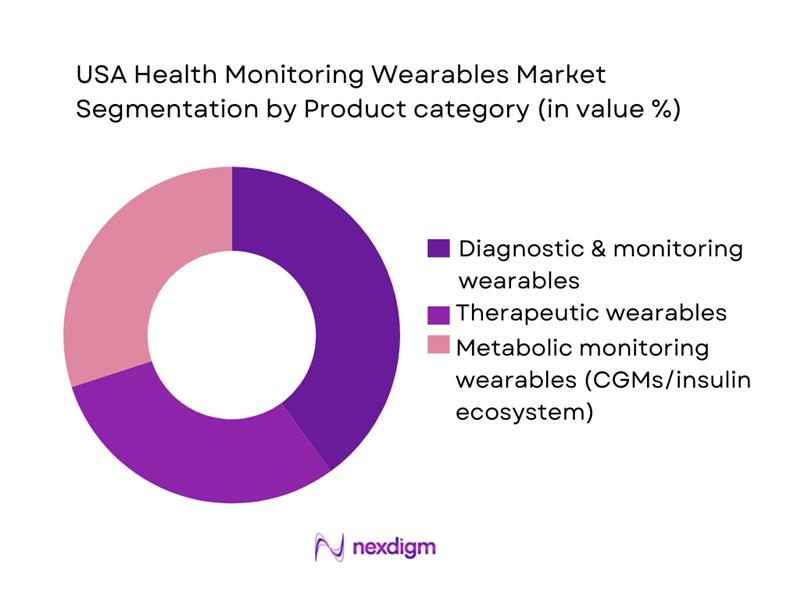
By Product Category
In the U.S., diagnostic and monitoring wearables dominate usage intensity because they serve both consumer wellness and medically oriented monitoring, making them the most scalable across channels. They benefit from broader “daily-wear” acceptance (wrist, patch, strap) and rising comfort with continuous measurements feeding alerts and dashboards for actionable insights. They also align strongly with the healthcare system’s shift toward preventive care and earlier detection, where continuous biometric streams help triage risk and support longitudinal monitoring outside clinics. At the same time, the U.S. has strong momentum in metabolic monitoring as devices expand beyond insulin users into wider consumer access models, boosting adoption. The combined effect is that monitoring-first products win because they maximize frequency of use, perceived value, and integration potential into digital health pathways.
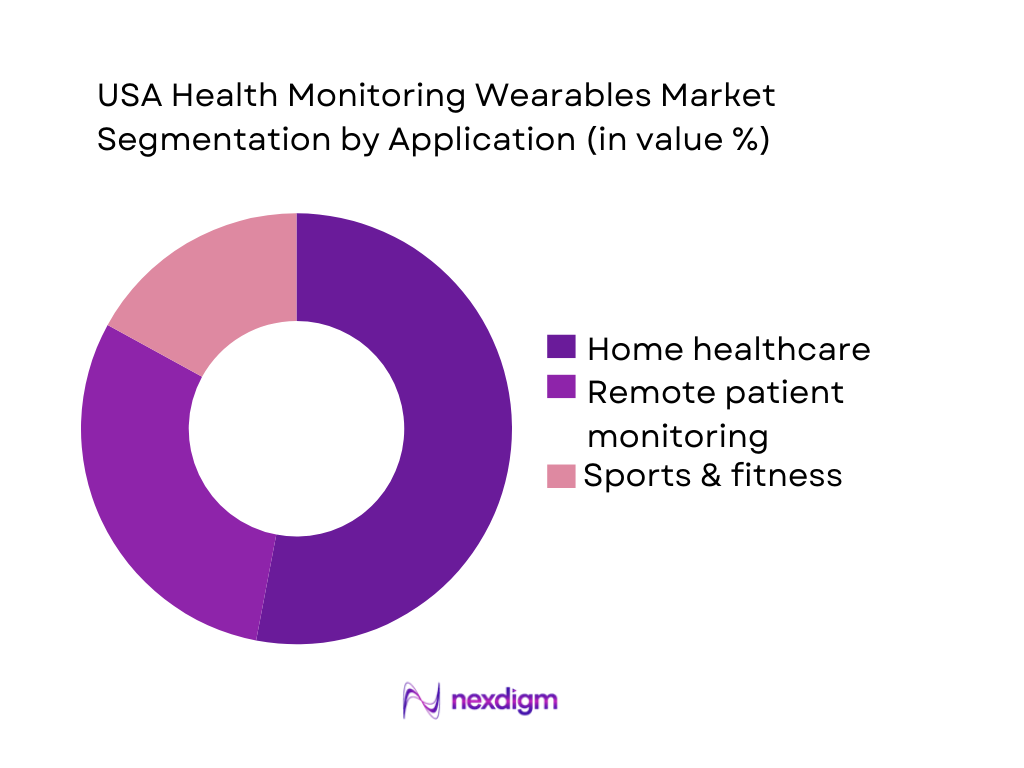
By Application
Home healthcare dominates because it best matches the U.S. reality of chronic disease prevalence, aging demographics, and the growing preference to manage conditions outside hospitals when clinically appropriate. Wearables reduce friction by automating frequent measurements and enabling continuous monitoring without repeated clinic visits, supporting adherence and earlier escalation when risk indicators appear. The value proposition is clearest in home settings: routine tracking of vitals, cardiac markers, sleep/respiratory signals, and glucose trends can be captured passively and shared with caregivers or care teams. This “always-on” model fits emerging care pathways that prioritize preventive interventions and remote follow-up. Meanwhile, sports & fitness grows quickly due to consumerization of health insights (sleep scoring, stress proxies, VO₂ estimates), but home healthcare remains structurally stronger because it ties directly to condition management and longer-term utilization.
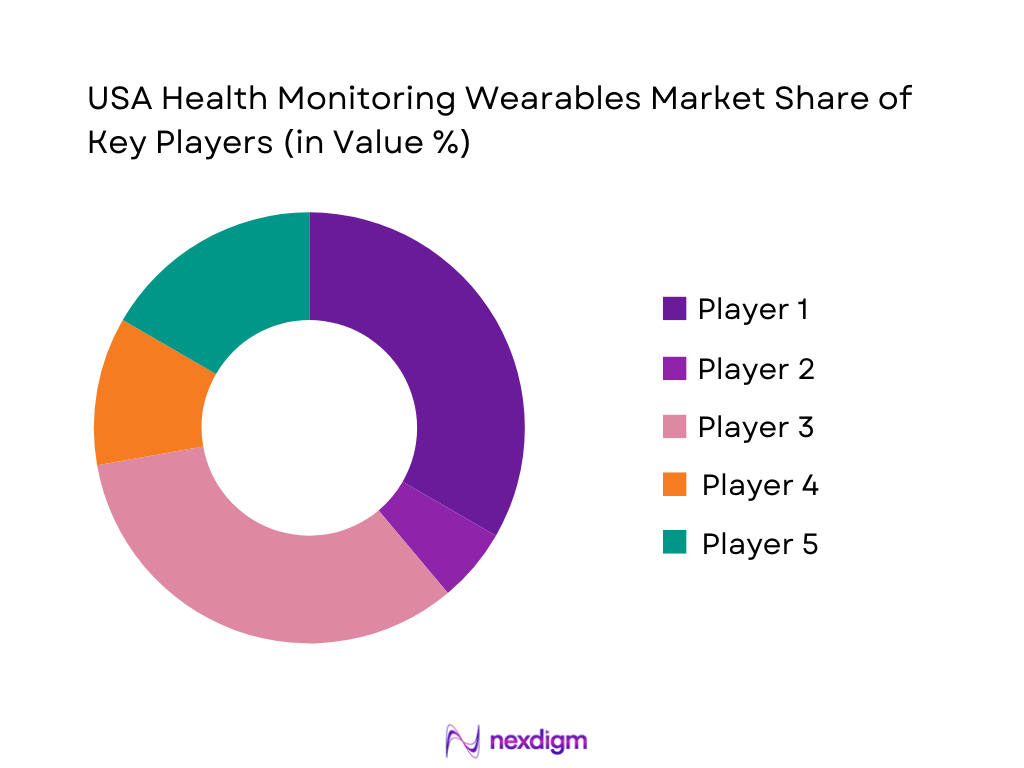
Competitive landscape
The U.S. health monitoring wearables market is characterized by platform-led consumer giants (smartwatch + services ecosystems) and clinical-grade biosensor leaders (notably glucose monitoring), with competition increasingly shaped by sensor accuracy, regulatory positioning, subscription analytics, and distribution leverage through retail, payers, and provider channels. The market remains innovation-heavy, with frequent feature releases and expanding use-cases spanning wellness to clinical monitoring.
| Company | Established | Headquarters | Core wearable category | Key health sensors / metrics | Clinical validation posture | Software / AI layer | Subscription model | Primary U.S. channels |
| Apple | 1976 | Cupertino, CA | ~ | ~ | ~ | ~ | ~ | ~ |
| Fitbit (Google) | 2007 | San Francisco, CA | ~ | ~ | ~ | ~ | ~ | ~ |
| Garmin | 1989 | Olathe, KS | ~ | ~ | ~ | ~ | ~ | ~ |
| Abbott | 1888 | Abbott Park, IL | ~ | ~ | ~ | ~ | ~ | ~ |
| Dexcom | 1999 | San Diego, CA | ~ | ~ | ~ | ~ | ~ | ~ |
USA Health Monitoring Wearables Market Analysis
Growth Drivers
Remote patient monitoring economics
The U.S. health monitoring wearables market is being pulled forward by the scale economics of remote monitoring across a very large publicly funded patient base and a high-throughput claims infrastructure. Medicare alone has ~ enrolled Americans, with ~ in Medicare Advantage plans—creating a large managed-care context where wearables-enabled monitoring can be operationalized for chronic care pathways and post-acute follow-ups. Medicare Fee-for-Service processes over ~ claims each year (about ~ per day), and more than ~ doctors, providers, and suppliers participate in Medicare—numbers that matter because remote monitoring becomes “deployable” when billing, documentation, and clinician participation are already systematized at national scale. On the macro side, the U.S. economy’s absolute size supports continuous health-tech investment cycles: the World Bank lists U.S. GDP at ~ trillion and GDP per capita at ~, which correlates with sustained spending capacity on healthcare delivery modernization and employer-sponsored benefits ecosystems that increasingly integrate device-led monitoring into care navigation and utilization management.
Preventive healthcare adoption
Preventive adoption is being reinforced by the U.S. disease burden and mortality reality that keeps cardiovascular and metabolic risks at the top of payer/provider agendas—creating a practical “why now” for continuous and passive monitoring via wearables. Provisional mortality analysis documents ~ deaths from heart disease in the country, underscoring why early detection, risk stratification, and continuous monitoring are increasingly embedded into prevention programs and care pathways. In parallel, diabetes mortality statistics list ~ deaths, reinforcing the relevance of wearables that help identify and manage risk factors before high-cost acute episodes occur. Preventive momentum is further amplified by the country’s aging profile: the population age ~ and older rose to ~, increasing the size of the population segment most likely to require continuous monitoring, medication adherence support, and longitudinal risk management—use cases where wearables increasingly serve as the front-end sensor layer.
Challenges
Accuracy variability
Accuracy variability remains a market-specific barrier because U.S. adoption increasingly intersects with clinical expectations and regulated safety norms—meaning wearable outputs are often judged against clinical-grade measurement standards. Evidence of real-world performance and user-reported issues shows up in the adverse event ecosystem, which includes reports tied to smartwatch ECG functionality documenting malfunctions and clinically concerning interpretations in actual usage contexts. At the system level, the operational footprint is massive: Medicare Fee-for-Service processes over ~ claims annually and involves over ~ participating providers, so even small measurement inconsistencies can translate into large volumes of follow-up events and workflow friction when scaled across large populations. Macro context increases the stakes: with U.S. GDP of ~ trillion and a national population of ~, the healthcare system runs at a scale where sensor accuracy issues can ripple widely across utilization patterns, clinical trust, and payer policy decisions.
Reimbursement complexity
Reimbursement complexity constrains U.S. wearables adoption because moving from consumer gadget to clinically integrated monitoring often requires navigating coverage rules, documentation, provider eligibility, and payer-specific medical policy across Medicare, Medicaid, and commercial plans. The scale and fragmentation are visible in public program coverage structure alone: ~ Americans are enrolled in Medicare and ~ are covered by Medicaid, meaning vendors face multiple reimbursement regimes with different medical necessity criteria. The operational layer is equally large: Medicare includes ~ institutional providers and over ~ participating providers and suppliers, translating into significant variability in billing sophistication and audit readiness. Even when coverage exists, administrative throughput requirements are huge: Medicare Fee-for-Service processes over ~ claims per year, materially affecting adoption at scale.
Opportunities
Smart rings and discreet form factors
Smart rings and other discreet wearables represent a strong U.S. opportunity because large, clinically relevant populations need passive, comfortable monitoring in everyday and overnight contexts where wrist wearables may be intrusive. Sleep-related monitoring is a clear example: clinical community figures indicate nearly ~ U.S. adults have obstructive sleep apnea, supporting demand for overnight-friendly form factors that can track sleep proxies and oxygen saturation trends with higher adherence. This opportunity is reinforced by demographic scale: the U.S. has ~ people age ~ and older, a segment with higher incidence of sleep-disordered breathing, atrial fibrillation risk, and comorbidity clustering. The macroeconomic environment supports premiumization and adoption across channels, with U.S. GDP per capita at ~ and GDP at ~ trillion, correlating with the ability to finance device adoption linked to risk reduction and care navigation.
Multimodal sensing platforms
Multimodal sensing is a high-potential U.S. opportunity because clinical and payer stakeholders increasingly need higher confidence signals than single-sensor metrics. Documentation highlights ~ AI-enabled medical devices, illustrating the rapid expansion of regulated algorithmic interpretation across healthcare; multimodal wearables can provide richer input data streams that improve signal reliability. System scale makes this opportunity particularly U.S.-specific: Medicare Fee-for-Service processes over ~ claims annually, and the Medicare ecosystem includes ~ institutional providers, meaning the operational value of more accurate, context-aware monitoring is very high when deployed across large populations. Demographics further justify multimodal platforms: a population age ~ of ~ increases the concentration of multi-morbidity, where combining motion, sleep, heart rhythm, and oxygenation signals can better characterize risk states than any single parameter.
Future outlook
Over the next five years, the U.S. health monitoring wearables market is expected to accelerate as biosensing becomes more medical-grade, device form factors diversify beyond watches, and care models normalize continuous monitoring for chronic disease management and preventive screening. Expansion of over-the-counter pathways in specific categories and deeper integration into provider workflows will raise utilization frequency. Regulatory expectations around claims and data handling will further shape product roadmaps, pushing vendors to combine accuracy, privacy, and clinical utility.
Major players
- Apple
- Fitbit (Google)
- Garmin
- Samsung Electronics
- Withings
- Koninklijke Philips
- Omron
- Medtronic
- Abbott
- Dexcom
- VitalConnect
- Sotera Wireless
- Polar Electro
- Masimo
Key target audience
- Chief Strategy Officer / VP Strategy
- Wearables & Consumer Devices OEMs
- Head of Product
- VP Clinical Innovation
- Director of Procurement
- Head of Population Health
- Corporate Benefits Head
- Investments and Venture Capitalist Firms
- Government and Regulatory Bodies
Research methodology
Step 1: Identification of Key Variables
We start by mapping the U.S. wearables ecosystem across OEMs, biosensor makers, platform/app layers, channels, and care delivery stakeholders. Desk research compiles category definitions, regulatory positioning, sensor modalities, and major adoption use-cases. This step establishes the critical variables that drive demand: chronic disease burden, channel access, reimbursement adjacencies, sensor accuracy, and data integration requirements.
Step 2: Market Analysis and Construction
We compile historical revenue signals and category expansion patterns, focusing on how device classes convert into recurring revenue via replenishment, subscriptions, and services. We analyze pricing architecture, attach rates, and channel economics. We also assess adoption catalysts such as access moves in biosensing and expansion of home monitoring programs.
Step 3: Hypothesis Validation and Expert Consultation
Hypotheses are validated through structured expert consultations with stakeholders across OEM product teams, operators, channel partners, and clinicians using wearables in care pathways. These interviews stress-test assumptions on usage intensity, drop-off drivers, data quality requirements, and procurement criteria. Inputs are cross-verified against publicly stated positioning, regulatory updates, and market commentary.
Step 4: Research Synthesis and Final Output
Finally, we triangulate insights using a bottom-up build and a top-down reconciliation against published market totals and growth trajectories. We normalize definitions, document constraints, and finalize segment logic for business decision-making—covering competition mapping, opportunity pockets, and go-to-market implications for U.S.-specific commercialization.
- Executive Summary
- Research Methodology (Market Definitions and Assumptions, Abbreviations, Inclusion/Exclusion Criteria, Market Sizing Approach, Triangulation Logic, Primary Research Approach, Secondary Research Approach, Demand-Side vs Supply-Side Modeling, Accuracy and Validation Filters, Limitations and Future Conclusions)
- Definition and Scope
- Market Genesis and Evolution
- Wearable Form-Factor Landscape
- Health Data Flow Architecture
- Supply Chain and Value Chain Analysis

- Growth Drivers
Remote patient monitoring economics
Preventive healthcare adoption
Employer and insurer incentive programs
AI-driven health insights - Challenges
Accuracy variability
Reimbursement complexity
Data privacy and cybersecurity risks
Integration with clinical workflows
Device fatigue - Opportunities
Smart rings and discreet form factors
Multimodal sensing platforms
Payer-grade outcomes tracking
Device-as-a-service business models - Trends
Sensor fusion
On-device inference
Subscription-led ecosystems
Expansion of medical-grade validation - Regulatory & Policy Landscape
- SWOT Analysis
- Stakeholder & Ecosystem Analysis
- Porter’s Five Forces Analysis
- Competitive Intensity & Ecosystem Mapping
- By Value, 2019–2024
- By Unit Shipments, 2019–2024
- By ASP, 2019–2024
- By Revenue Mix, 2019–2024
- By Channel Mix, 2019–2024
- By Fleet Type (in Value %)
Smartwatches
Fitness Bands
Smart Rings
Wearable Patches
Continuous Glucose Monitoring Wearables - By Application (in Value %)
Lifestyle and Fitness Optimization
Chronic Disease Management
Remote Patient Monitoring Programs
Post-acute and Post-procedure Monitoring
Women’s Health and Fertility Tracking - By Technology Architecture (in Value %)
Heart Rate and HRV Monitoring
ECG and Arrhythmia Detection
Blood Oxygen Monitoring
Blood Pressure Monitoring
Temperature and Respiratory Rate Monitoring - By Connectivity Type (in Value %)
Bluetooth Low Energy
Wi-Fi Enabled
Cellular Enabled
Hybrid Connectivity - By End-Use Industry (in Value %)
Direct Consumers
Employers and Corporate Wellness
Providers and Health Systems
Payers and Managed Care Organizations
Government and Public Health Programs - By Region (in Value %)
Northeast
Midwest
South
West
- Market Share of Major Players
- Cross Comparison Parameters (Regulatory portfolio depth, Clinical validation and accuracy evidence, Sensor stack and signal quality, Algorithm and AI capabilities, Ecosystem integration and API openness, Subscription model and ARPU, RPM and payer partnerships, Cybersecurity and privacy readiness)
- Product and SKU Pricing Analysis
Strategic moves and partnerships - Detailed Profiles of Major Companies
Apple
Google Fitbit
Samsung Electronics
Garmin
WHOOP
Oura Health
Withings
Omron Healthcare
Abbott
Dexcom
Medtronic
Philips
Masimo
iRhythm Technologies
- Consumer personas
- Provider personas
- Payer and employer buying criteria
- Decision-making journey
- Pain points and unmet needs
- By Value, 2025–2030
- By Unit Shipments, 2025–2030
- By ASP, 2025–2030
- By Revenue Mix, 2025–2030


 Request a Sample
 Ask for Customization
 Get a Quote
 Enquire Now