
 Download PDF
 Download PDF
Market Overview
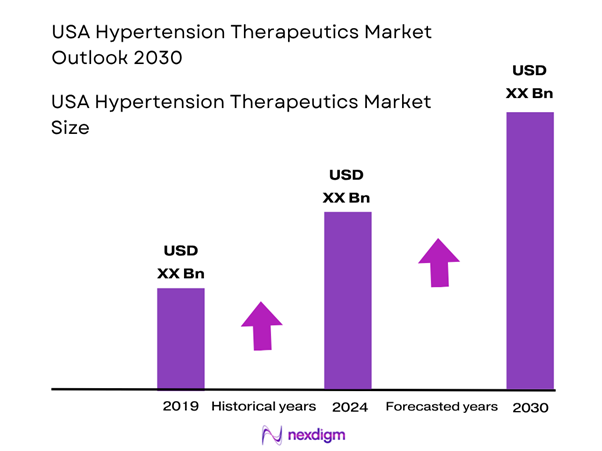
The USA hypertension therapeutics market is valued at approximately USD ~ billion in 2024. This sizeable base reflects growing diagnosis rates of hypertension, an ageing population, expanding comorbidity burdens (diabetes, obesity), increased guideline recommendations for earlier and more aggressive treatment, and adoption of newer fixed-dose combination therapies and adjunctive device-based treatments. The increase from roughly USD 8.22 billion in 2023 illustrates steady momentum in therapy uptake.
Major metropolitan hubs such as New York, Los Angeles, Chicago, Houston, and Miami dominate the USA hypertension therapeutics market, owing to high population density, strong healthcare infrastructure (specialist cardiology and nephrology centres), high rates of hypertension and related cardiovascular disease, and greater access to advanced therapies (fixed-dose combinations, device adjuncts). These cities often host large academic medical centres driving prescription uptake and clinical trial enrollment, which further accelerates therapy adoption.
Market Segmentation
By Drug Class
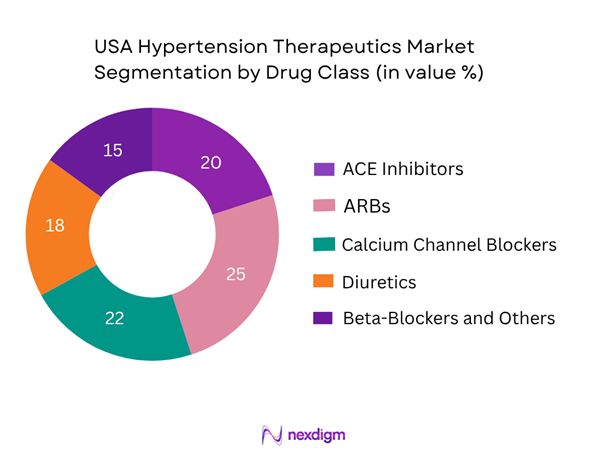
The USA hypertension therapeutics market is segmented by drug classes into ACE inhibitors, ARBs, calcium channel blockers (CCBs), diuretics and beta-blockers/others. Among these, ARBs are currently commanding the largest share (around 25 %) because of their favourable side-effect profiles compared to ACE inhibitors and wide physician familiarity, strong guideline recommendation in renal comorbidity settings, and availability of newer combination formulations. In addition, CCBs are also strong performers (22 %) driven by their long-term legacy use, once-daily dosing convenience and broad patient acceptance, which supports their dominance.
By Treatment Type
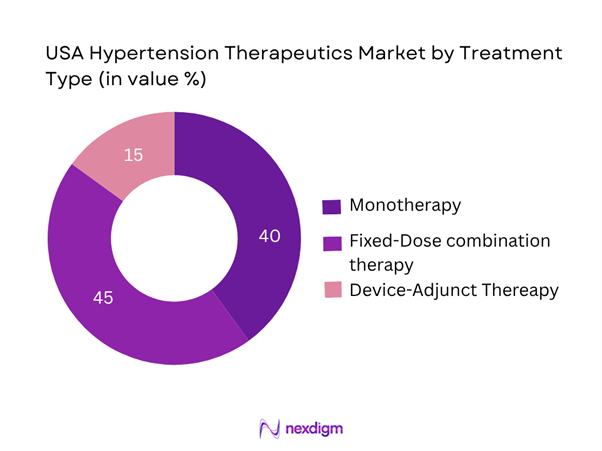
This segmentation distinguishes between monotherapy, fixed-dose combination therapy (FDCs) and device-adjunct therapies (such as renal denervation, baroreceptor modulation). The fixed-dose combination therapy sub-segment dominates (≈ 45 %) because of growing recognition of the need for multi-mechanism control of blood pressure, better patient adherence due to simplified regimens, and payer pressure to reduce pill burden. As a result, FDCs are increasingly preferred over monotherapy, thereby capturing the largest share among treatment types.
Competitive Landscape
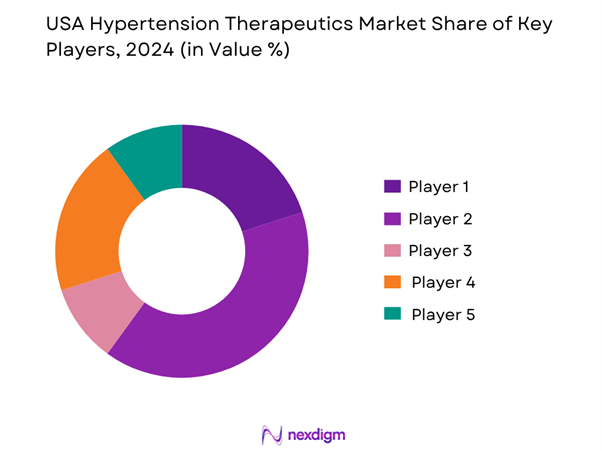
The USA hypertension therapeutics market is moderately consolidated, with a mix of major global pharmaceutical firms and specialized cardiovascular and device-therapy players. Leading competitors maintain significant influence through broad drug portfolios, pipeline therapies for resistant hypertension, fixed-dose combinations, patents and device innovations. The presence of generics and new entrants means competitive intensity remains high, but the top players retain strong market power through differentiated offerings and distribution networks.
| Company | Establishment Year | Headquarters | Key Hypertension Product Portfolio | Fixed-Dose Combination Focus | Device/Adjunct Therapy Involvement | R&D Hypertension Pipeline | US Hypertension Revenue Approx. |
| Novartis AG | 1996 | Basel, Switzerland | – | – | — | – | – |
| Pfizer Inc. | 1849 | New York, USA | – | – | — | – | – |
| AstraZeneca Plc | 1999 | Cambridge, UK | – | – | – | – | – |
| Sanofi | 1973 | Paris, France | – | – | — | – | – |
| Johnson & Johnson | 1886 | New Brunswick, USA | – | – | – | – | – |
USA Hypertension Therapeutics Market Analysis
Key Growth Drivers
High Prevalence and Untreated Burden of Hypertension
In the United States, 47.7 % of adults age 18 and older were found to have hypertension (defined as systolic ≥130 mm Hg or diastolic ≥80 mm Hg, or taking antihypertensive medication) during August 2021-August 2023. Among those adults, just 51.2 % were currently taking medication to lower blood pressure. This large untreated or undertreated patient base creates a sustained need for therapeutic interventions—from initial monotherapies to combination regimens and adjunctive treatments. The fact that over half of hypertensive adults are not on treatment underscores latent demand for hypertension-therapeutics innovation and uptake.
Digital Health Integration and Care-Delivery Transformation
Digital-health solutions are increasingly influencing hypertension management in the U.S., with home blood-pressure monitoring, virtual coaching and remote medication-management platforms demonstrating efficacy in improving outcomes. For example, digital medication-management solutions combining connected cuffs and virtual care teams have been singled out as potential long-term cost savers by improving control. As healthcare systems, payers and providers adopt these tools, the uptake of advanced therapeutic regimens (such as fixed-dose combinations and device-adjunct therapies) is supported by better monitoring and adherence infrastructure—thereby amplifying demand for innovative hypertension therapeutics beyond legacy monotherapies.
Key Market Challenges
Low Blood Pressure Control Rates and Non-Adherence to Medication
Despite over 122 million adults living with hypertension in the U.S., only 48 million maintain controlled blood pressure. Around 26 million adults who are aware of their condition remain untreated, reflecting gaps in medication adherence and clinical follow-up. Non-adherence contributes to nearly 700,000 cardiovascular deaths annually, as reported by the National Institutes of Health. This uncontrolled segment leads to repeated hospitalizations, increased healthcare spending, and missed opportunities for treatment escalation with advanced therapeutics. The resulting burden reinforces the challenge of translating diagnosis into long-term pharmacological adherence.
Generic Saturation and Regulatory Pressure
The U.S. healthcare expenditure stood at USD 4.5 trillion in 2022, or about USD 13,493 per capitaWithin this structure, hypertension drugs—largely generics such as ACE inhibitors and beta-blockers—face price compression due to federal and state cost-containment policies. The Inflation Reduction Act of 2022 introduced Medicare drug price negotiations, adding compliance challenges for manufacturers. Meanwhile, the U.S. FDA approved over 1,000 generic drugs between 2020 and 2023 (fda.gov), intensifying competition and squeezing margins for branded players. This heightened regulatory oversight restricts the launch of premium-priced innovations and pressures companies to justify clinical and economic superiority
Emerging Market Opportunities
Expanding Base of Resistant Hypertension Patients
Approximately 15 million U.S. adults are estimated to have treatment-resistant hypertension (TRH)—defined as uncontrolled blood pressure despite three or more antihypertensive drugs—according to the National Institutes of Health. TRH patients exhibit a twofold higher risk of heart failure and kidney disease, creating demand for novel drug classes such as aldosterone synthase inhibitors and non-steroidal mineralocorticoid receptor antagonists. The FDA’s approval of renal denervation devices in 2023 marked a paradigm shift, introducing device-based adjuncts to standard drug therapy With over 70% of TRH cases linked to obesity and CKD, this segment remains an untapped therapeutic opportunity for integrated drug-device models and precision medicine adoption.
Integration of Digital Therapeutics and Remote Patient Monitoring
The U.S. Department of Health and Human Services reports that 69% of healthcare providers now use telehealth and remote monitoring tools for chronic disease management. Remote blood pressure monitoring programs under the CMS Chronic Care Management model cover over 30 million Medicare beneficiaries, improving adherence and early intervention. Additionally, the American Heart Association confirms that patients engaged in continuous monitoring achieve twice the rate of blood pressure control compared to standard care. This digital-health penetration strengthens the ecosystem for real-time data-driven hypertension management, supporting greater prescription persistence, fixed-dose combination adoption, and drug-device synchronization—thereby unlocking future therapeutic scalability.
Future Outlook
Over the next six years the USA hypertension therapeutics market is expected to grow steadily, driven by the convergence of several strategic and clinical trends. Ongoing guideline evolution toward lower blood pressure targets, increasing awareness of treatment-resistant hypertension, rising adoption of fixed-dose combination therapies, and integration of digital health monitoring will underpin growth. At the same time, pressures such as generic erosion, price-containment by payers and clinical inertia will temper upside. The growth trajectory suggests modest but sustained expansion toward ~USD 10.0-10.5 billion by 2030. Advancements in device-adjunct therapies and precision medicine may open incremental white-space opportunities beyond standard pharmacotherapy.
Major Players
- Novartis AG
- Pfizer Inc.
- AstraZeneca Plc
- Sanofi
- Johnson & Johnson
- Bayer AG
- Boehringer Ingelheim International GmbH
- Daiichi Sankyo Co., Ltd.
- Takeda Pharmaceutical Company Limited
- Merck & Co., Inc.
- AbbVie Inc.
- Amgen Inc.
- Viatris Inc.
- Lupin Limited
- CinCor Pharma Inc.
Key Target Audience
- Pharmaceutical / biotech companies (hypertension drug portfolio managers)
- Medical device firms (renal denervation, baroreceptor modulation providers)
- Investments & venture capitalist firms (cardiovascular & hypertension therapeutics)
- Hospitals & integrated health-systems (cardiology & hypertension clinics)
- Payers & insurance companies (commercial payers, Medicare/Medicaid)
- Government and regulatory bodies (e.g., U.S. Food & Drug Administration (FDA); Centers for Medicare & Medicaid Services (CMS))
- Health-technology assessment (HTA) agencies and public health bodies (e.g., Centers for Disease Control and Prevention (CDC))
- Contract manufacturing / outsourcing organisations (CMOs) and supply-chain partners in hypertension therapeutics
Research Methodology
Step 1: Identification of Key Variables
The initial phase involves mapping the entire hypertension therapeutics ecosystem in the USA — including patient population, treatment pathways, drug classes, fixed-dose combinations, device adjunct therapies, reimbursement dynamics and channel distribution. This step is supported by desk research drawing on secondary data sets (industry reports, pharmaceutical IQ, government databases) and proprietary databases to define critical variables influencing market size and growth.
Step 2: Market Analysis and Construction
This phase compiles and analyses historical data for the US hypertension therapeutics market covering revenues by drug class, treatment type. Moreover, treatment-utilisation rates, adherence metrics and price trends are assessed to validate revenue estimates.
Step 3: Hypothesis Validation and Expert Consultation
Hypotheses regarding market drivers, segmentation growth patterns and pipeline influence are formulated and validated through telephone and online expert interviews (cardiologists, nephrologists, pharma commercial leads, payers). These insights inform assumptions about uptake of fixed-dose combinations, device-adjunct therapies, and payer dynamics.
Step 4: Research Synthesis and Final Output
In the final phase, multiple data sources (company annual reports, clinical trial registries, regulatory filings) are synthesised with expert inputs to produce the validated market size, growth forecast, segmentation tables, competitive analysis and future outlook. The entire dataset is cross-checked for consistency and triangulated to ensure accuracy and reliability of output.
- Executive Summary
- Research Methodology (Market Definitions and Therapeutic Scope (e.g., primary vs. secondary hypertension, resistant hypertension), Abbreviations and Terminology, Historical & Forecast Market Sizing Approach, Consolidated Research Approach, Epidemiology & Patient-Population Profiling Method, Limitations, Assumptions and Future Outlook Considerations)
- Definition and Scope
- Disease Genesis & Pathophysiology
- Timeline of Major Therapeutic Milestones
- Hypertension Business Cycle
- Supply Chain and Value Chain Analysis

- Key Growth Drivers
Rising prevalence of oxidative stress–related conditions and respiratory health awareness.
Increasing adoption of NAC as a glutathione booster for liver and detox support.
Growth in online and DTC supplement sales across U.S. consumers. - Key Market Challenges
DA’s fluctuating stance on NAC’s supplement classification.
Raw-material sourcing volatility from limited global suppliers.
Low consumer education on dosage and product differentiation. - Opportunity Landscape
Expansion of clean-label, vegan, and liposomal NAC formulations.
Strong export potential for U.S.-manufactured NAC supplements.
Rising partnerships between supplement brands and digital wellness platforms. - Emerging Trends
Surge in gummy and flavored NAC product formats.
Growth of transparent labeling and ingredient-traceability claims.
Personalization of supplementation through digital health apps. - Regulatory & Reimbursement Environment
FDA enforcement discretion allowing NAC supplement sales.
DSHEA-compliant labeling and FTC claim oversight.
State-level variance in taxation and sales compliance. - SWOT Analysis
- Stakeholder Ecosystem
- Porter’s Five Forces Analysis
- By Value (USD) – historical baseline to latest year, 2019-2024
- By Volume (number of treated patients / defined daily doses), 2019-2024
- By Average Treatment Price (per patient/year or per defined course), 2019-2024
- By Drug Class (In Value %):
ACE Inhibitors
ARBs
Calcium Channel Blockers
Diuretics
Beta-Blockers & Others - By Treatment Type (In Value %):
Monotherapy
Fixed-Dose Combination Therapy
Device-Adjunct Therapy - By Patient Population / Indication (In Value %):
Primary (Essential) Hypertension
Secondary Hypertension (renal, endocrine, vascular causes)
Treatment-Resistant Hypertension - By Distribution Channel (In Value %):
Hospital / Inpatient Pharmacy
Outpatient / Clinic Pharmacy
Retail Pharmacy / Mail-Order
Specialty Pharmacy (for advanced therapies) - By Payer / Reimbursement Segment (In Value %):
Commercial Insurance
Medicare / Medicaid
Self-Pay / Cash-Pay / Other
- Market Share of Major Players
- Cross-Comparison Parameters (Company Overview, Business Strategy & Therapeutic Focus, Recent Developments, Strengths, Weaknesses, Organizational Structure & R&D footprint, Annual Revenues, Revenues by Drug Class / Indication, Number of Active Hypertension-Therapeutic Products (in US), Distribution Channels / Commercial Model, Production / Manufacturing Capacity & Outsourcing Strategy, Unique Value Proposition)
- SWOT Analysis of Major Players
- Pricing & Reimbursement Analysis
- Detailed Profiles of Major Companies:
Novartis AG
Pfizer Inc.
AstraZeneca Plc
Sanofi
Merck & Co., Inc.
Johnson & Johnson
Boehringer Ingelheim International GmbH
Daiichi Sankyo Co., Ltd.
Lupin Limited
AbbVie Inc.
Takeda Pharmaceutical Company Limited
Amgen Inc.
Regeneron Pharmaceuticals, Inc.
Mineralys Therapeutics Inc.
CinCor Pharma Inc.
- Patient Demand and Treatment Utilization Patterns
- Budget Allocations & Spend per Patient
- Clinical and Provider Decision-Making Process
- Patient Needs, Desires and Pain Points
- Digital Health Adoption & Telemedicine Impact
- By Value (USD), 2025-2030
- By Volume (treated patient numbers / DDDs), 2025-2030
- By Average Treatment Price (per patient/year), 2025-2030


 Request a Sample
 Ask for Customization
 Get a Quote
 Enquire Now