
 Download PDF
 Download PDF
Market Overview
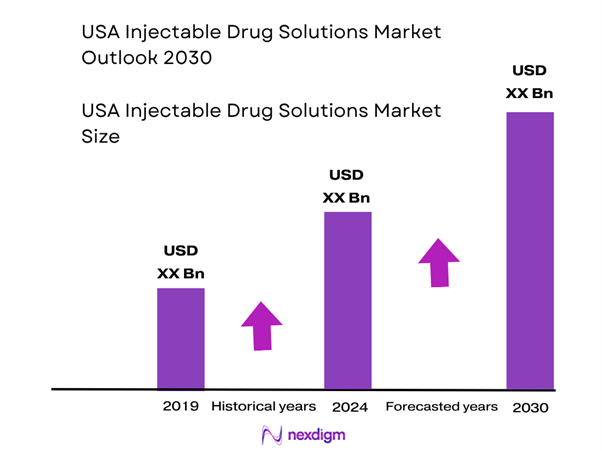
The USA injectable drug solutions market is valued at approximately USD ~ billion in the base year, according to North America data from 2024 for the broader injectable drug delivery space. Growth is being driven by rising incidence of chronic diseases (e.g., diabetes, oncology, autoimmune disorders), increasing uptake of biologic and biosimilar injectable therapies, home-injectable convenience, and expansion of delivery formats (prefilled syringes, autoinjectors).
The U.S. market leads among cities/regions thanks to its mature healthcare infrastructure, large patient base, robust R&D ecosystem and high pharmaceutical spending. Major metropolitan hubs such as New York, Los Angeles, Chicago and Boston host leading biopharma and contract manufacturing organizations, driving product development and adoption of injectables. The advanced supply chain, reimbursement frameworks and hospital networks further reinforce dominance of the U.S. market relative to other geographies.
Market Segmentation
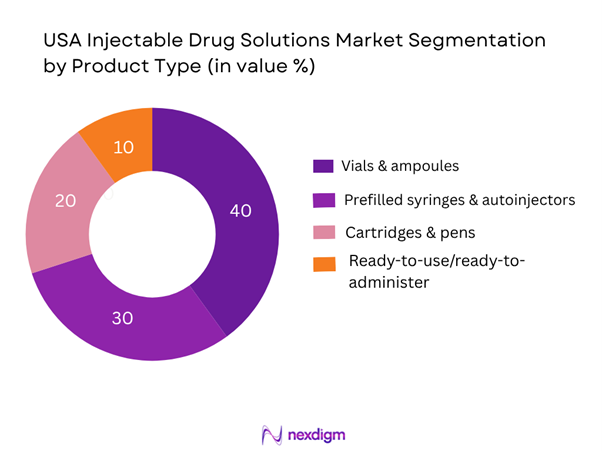
By Product Type
Among these, vials & ampoules dominate market share in 2024. This is due to their long-established usage in hospital and acute-care settings, high production volume, regulatory familiarity, and the fact that many injectable therapies (especially biologics and oncology injectables) are still delivered via vials. Hospitals remain major end-users for these formats and manufacturing scale advantages favour vials. Meanwhile, prefilled syringes/autoinjectors are growing rapidly but from a smaller base.
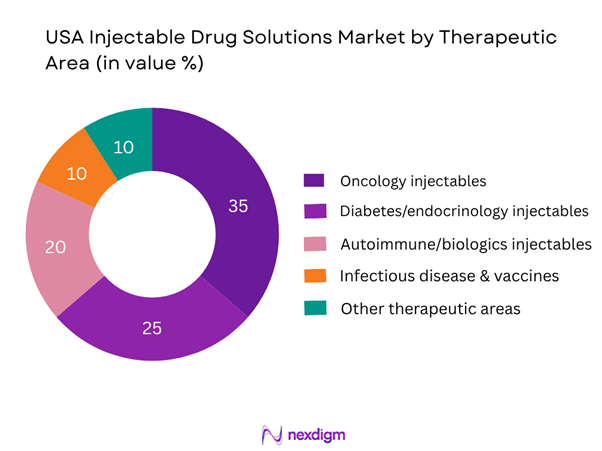
By Therapeutic Area
In this segmentation, the oncology injectables sub-segment commands the largest share in 2024. This dominance arises from the high cost and uptake of injectable therapies in cancer treatment (including monoclonal antibodies, checkpoint inhibitors, chemotherapy delivered intravenously), frequent dosing requirements, and strong pipeline launching new injectable formulations. Given the severity and high margin of oncology treatments, investment and adoption are higher, which supports its leading share.
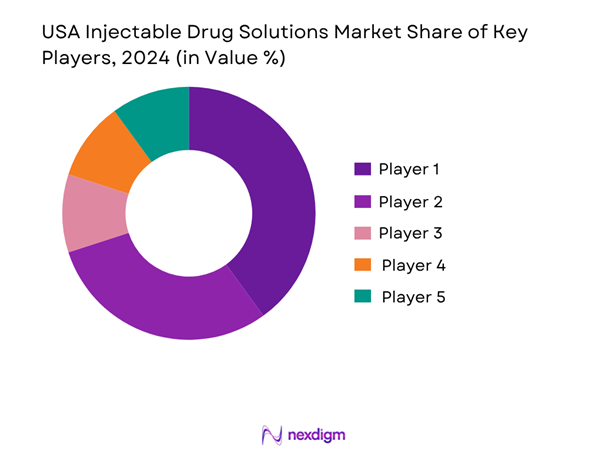
Competitive Landscape
The USA injectable drug solutions market features significant participation by established global and U.S.-based pharmaceutical and drug-delivery companies, many with strong injectable-drug portfolios and manufacturing capabilities. The competitive landscape is moderately consolidated among key players with strong R&D, manufacturing scale, and distribution networks.
| Company | Establishment Year | Headquarters | Key Injectable Portfolios | Manufacturing/Injectable Focus | Recent Strategic Moves | Remarks |
| Pfizer Inc. | 1849 | New York, NY (USA) | – | – | – | – |
| Amgen Inc. | 1980 | Thousand Oaks, CA | – | – | – | – |
| Baxter International Inc. | 1931 | Deerfield, IL (USA) | – | – | – | – |
| Fresenius Kabi | 1999 | Bad Homburg, Germany (US ops in U.S.) | – | – | – | – |
| Johnson & Johnson | 1886 | New Brunswick, NJ (USA) | – | – | – | – |
USA Injectable Drug Solutions Market Analysis
Growth Drivers
Rising chronic disease burden
In the U.S., approximately 194 million adults reported having one or more chronic conditions in 2023—equivalent to 76.4% of the adult population. In parallel, some 35.5 million U.S. adults were estimated to have chronic kidney disease (about 14% of adults) in 2023. These high and growing numbers of patients with chronic illnesses such as diabetes, cardiovascular diseases, kidney disease and autoimmune disorders create a sustained need for injectable therapies (e.g., biologics, GLP-1s, insulin, immunotherapies) which are the backbone of the injectable drug solutions space. The burden of disease thus directly expands the patient pool, drives treatment frequency and complexity, and supports demand for injectable drug delivery formats.
Biologics uptake
In the U.S., the biologics sector has grown significantly: biologic medicines now comprise about 46% of total pharmaceutical spending in recent years. In 2024, among U.S. adults with diagnosed diabetes, 26.5% (about 6.9 million adults) used GLP-1 injectables. This deepening penetration of injectable biologics and advanced therapies (especially in oncology, immunology and endocrinology) fuels demand for an expanded range of injectable drug solutions. The growing shift toward biologic and specialty injectables increases demand for vial/ampoule formats, carrier technologies, fill/finish operations, and delivery devices, thereby driving growth in the injectable drug solutions market.
Market Challenges
Sterile manufacturing complexity
Manufacturing sterile injectable drugs in the U.S. carries substantial operational, regulatory and capital burdens. The production requires aseptic fill/finish, clean-room infrastructure, high-end process controls, and rigorous sterility assurance—conditions that raise entry barriers and limit flexibility. According to data, as of December 2024, 69% of all U.S. drug shortage events were attributable to sterile injectable medications, signalling fragility in the supply chain and manufacturing base. The complexity and cost of sterile manufacturing thus represent a significant challenge to scalable growth in the injectable drug solutions market.
Drug shortage risks
The U.S. continues to experience pervasive drug-shortage events, particularly in injectable segments. A registered study indicates that new shortages of injectable drugs comprised 53.7% (n = 381) of all new shortage events during a certain period, compared with 38.2% for oral drugs. In early 2024, 323 medications were in active shortage—the highest number tracked—many of them sterile injectable medications used in critical care. These shortages introduce risk for manufacturers, increase supply-chain instability, and may deter investment in injectable drug manufacturing capacity, thereby restraining market growth.
Opportunities
Injectable biosimilars
In the United States, biosimilars have begun to gain traction but still represent only about one-third of what brand biologics command in many injectable categories as of 2023. With large biologic molecules facing patent expiry and regulatory support for biosimilar adoption increasing, there is an opportunity for manufacturers and service-providers in injectable drug solutions to cater to biosimilar formulations requiring sterile fill/finish, tailored delivery devices, and scaled manufacturing. The injectable biosimilar segment offers pathways to lower-cost biologic therapies, greater access, and higher adoption, all of which stimulate demand in the injectable drug solutions ecosystem.
Self-injectable formats
The rise of self-injectable therapies—evidenced by, for example, 26.5% of U.S. adults with diagnosed diabetes using GLP-1 injectables in 2024. A opportunity for drug solution providers to develop and supply more user-friendly delivery formats (autoinjectors, prefilled syringes, wearable injectors) and move therapies from clinic-based to home-based administration. The existing architecture of home-care, patient convenience and device innovation positions this segment as a growth zone for injectable drug solutions beyond traditional facility-based delivery.
Future Outlook
Over the next six years, the U.S. injectable drug solutions market is expected to show robust growth driven by expanding biologic/biopharmaceutical adoption, increasing home-care and self-injection trends, growth in oncology and immunology therapies, and advancements in drug delivery formats (autoinjectors, wearable injectors). The heightened demand for convenient, high-efficacy injectable treatments in chronic and acute settings will continue to push market expansion. Supply-chain resilience (sterile manufacturing, fill-finish capacity) and regulatory incentives will also play a key role in shaping growth.
Looking ahead, key growth will stem from emerging delivery technologies, expanded indications for injectable biologics, increased patient self-administration, and reshoring/scale-up of U.S.-based manufacturing of sterile injectables to mitigate shortage risk. Regulatory focus on manufacturing quality, contracting, and reimbursement will influence competitive positioning and investment decisions.
Major Players
- Pfizer Inc.
- Amgen Inc.
- Baxter International Inc.
- Fresenius Kabi
- Johnson & Johnson
- Novartis AG
- Roche Holding AG
- Sanofi S.A.
- Eli Lilly & Co.
- Teva Pharmaceutical Industries Ltd.
- Bristol‑Myers Squibb
- AbbVie Inc.
- Mylan N.V.
- Pfizer Wyeth Biologics (Note: Biologics arm)
- Hospira, Inc.
Key Target Audience
- U.S.-based pharmaceutical and biotech companies with injectable portfolios
- Medical device manufacturers focused on injectable delivery systems
- Investments and venture capital firms targeting injectable drug manufacturing or delivery innovations
- Government and regulatory bodies (e.g., U.S. Food & Drug Administration (FDA), Centers for Medicare & Medicaid Services (CMS))
- Hospital chains and healthcare provider groups evaluating injectable drug procurement
- Contract manufacturing organizations (CMOs)/fill-finish service providers specializing in sterile injectables
- Private equity firms exploring consolidation in sterile injectable manufacturing
- Hospital pharmacy groups and major group-purchasing organizations (GPOs) engaged in large-scale injectable drug sourcing
Research Methodology
Step 1: Identification of Key Variables
The initial phase involves constructing an ecosystem map encompassing all major stakeholders within the U.S. injectable drug solutions market. This step is underpinned by extensive desk research, utilizing a combination of secondary industry databases, peer-reviewed articles, company disclosures, and proprietary business intelligence to gather comprehensive industry-level information. The primary objective is to identify and define the critical variables that influence market sizing, segmentation, competitive dynamics, and growth drivers.
Step 2: Market Analysis and Construction
In this phase, we compile and analyze historical data pertaining to the U.S. injectable drug solutions market. This includes assessing market penetration of injectable formats, ratio of inpatient vs outpatient injectable delivery, the resultant revenue generation by segment, and distribution channel trends. Furthermore, an evaluation of manufacturing capacities (sterile fill/finish), regulatory approvals (FDA injections/biologics), and service quality statistics is conducted to ensure the reliability and accuracy of the revenue estimates.
Step 3: Hypothesis Validation and Expert Consultation
Market hypotheses—such as projected CAGR, technology adoption rates, and sub‐segment dominance—will be developed and subsequently validated through interviews (via CATI or virtual meetings) with industry experts representing pharmaceutical companies, device manufacturers, hospital pharmacy executives, and injectable-manufacturing service providers. These consultations provide operational and financial insights directly from practitioners, which will be instrumental in refining and corroborating the market data.
Step 4: Research Synthesis and Final Output
The final phase involves triangulating bottom-up estimates (based on individual sub-segment revenues, pricing trends, unit volumes) with top-down projections (based on macro-healthcare spending, chronic-disease prevalence, biologics pipelines) and expert validation. This interaction will serve to verify and complement the statistics derived, thereby ensuring a comprehensive, accurate, and validated analysis of the U.S. injectable drug solutions market.
- Executive Summary
- Research Methodology (Market definitions & scope, Abbreviations & nomenclature, Market sizing approach – top-down and bottom-up for the U.S. injectable solutions market, Primary research approach, Secondary research, Data validation/triangulation methods, Limitations, assumptions & future outlook caveats)
- Definition and Scope
- Market Genesis & Evolution
- Regulatory & Reimbursement Environment
- Supply Chain & Value Chain Analysis

- Growth Drivers
Rising chronic disease burden
Biologics uptake
Home-care self-injection trend - Market Challenges
Sterile manufacturing complexity
Drug shortage risks - Opportunities
Injectable biosimilars
Self-injectable formats
Connected injectables - Trends
Shift to subcutaneous vs IV
On-body injectors
Auto-injectors - Ecosystem & Stakeholder Landscape
Pharma Companies
Contract Manufacturing Organisations (CMOs)
Drug delivery device OEMs
Healthcare providers
Price Dynamics & Reimbursement Trends - Regulatory & Policy Landscape (impact of U.S. FDA sterile manufacturing guidance, drug-shortage mitigation policies)
- Risk & Uncertainty Assessment (manufacturing disruption risk, supply-chain vulnerabilities)
- SWOT Analysis
- Porter’s Five-Forces Analysis
- By Value – injectable solutions market in the U.S., 2019-2024
- By Volume – units of injectable formulations, 2019-2024
- By Average Price – per dose/ vial / pre-filled syringe average price trends, 2019-2024
- By Drug Type (Value %)
Small-molecule sterile injectables (generic and branded)
Biologics/monoclonal antibody injectables
Biosimilar injectables
Specialty/ orphan disease injectables
Vaccine injectables - By Route of Administration (Value %)
Intravenous (IV)
Subcutaneous (SC)
Intramuscular (IM)
Other (intra-dermal, intra-ocular etc) - By Delivery Format (Value %)
Vials & ampoules
Pre-filled syringes
Auto-injectors / pen injectors
Wearable injectors / on-body devices - By End-User Setting (Value %)
Hospitals & acute-care centres
Clinics & ambulatory care centres
Home-care / self-administration
Long-term care / specialty infusion centres - By Therapeutic Indication (Value %)
Oncology
Autoimmune disorders (RA, MS, IBD)
Diabetes & metabolic disorders
Infectious diseases (vaccines, antivirals)
Central nervous system & others - By Region within USA (Value %)
Northeast
Midwest
South
West
- Market Share of Major Players by Value/Volume
- Cross-Comparison Parameters (Company Profile, Business Strategy, Recent Product Launches, Strengths, Weaknesses, Revenue by Injectable Segment, Number of Injectable SKUs, Manufacturing Footprint, Device Patents, Geographic Reach, R&D Pipeline for Injectable Solutions, Distribution & Channel Reach, Margin Profile, Regulatory Compliance Record)
- Detailed Profiles of Major Companies
Pfizer Inc.
Johnson & Johnson
Roche Holding AG
Amgen Inc.
Eli Lilly and Company
Novartis AG
Sanofi S.A.
Merck & Co., Inc.
Bristol Myers Squibb Company
AbbVie Inc.
Gilead Sciences, Inc.
Novo Nordisk A/S
Takeda Pharmaceutical Company Limited
Baxter International Inc.
Catalent Inc.
- Hospital & Health-System Demand Patterns
- Self-Administration / Home-care Adoption Trends
- Procurement & Budget Allocation Practices
- Buyer Needs, Preferences & Pain-Points
- Decision-Making Process & Stakeholder Influence
- Forecast by Value, 2025-2030
- Forecast by Volume, 2025-2030
- Forecast by Average Price / Dose, 2025-2030


 Request a Sample
 Ask for Customization
 Get a Quote
 Enquire Now