
 Download PDF
 Download PDF
Market Overview
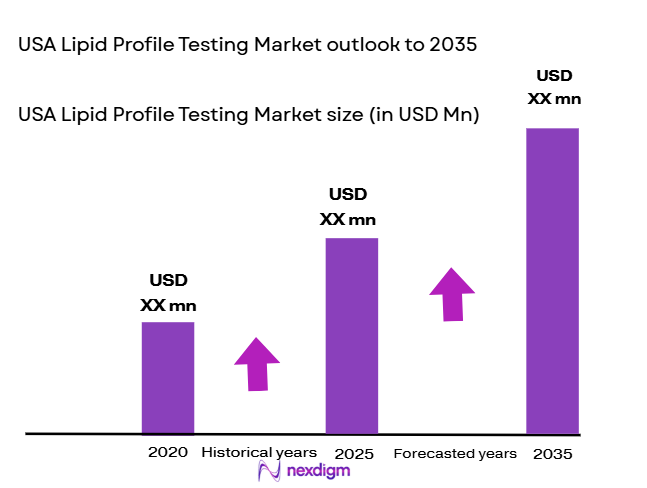
The USA Lipid Profile Testing market is projected to reach a significant value driven by rising health concerns surrounding cardiovascular diseases, diabetes, and obesity, which have intensified the demand for regular lipid profile testing. In 2023, the market was valued at approximately USD ~ billion, with the projected growth in 2024 marking a continued expansion due to increased awareness around preventive healthcare. The demand is primarily driven by rising healthcare expenditure, government-funded preventive health initiatives, and advancements in diagnostic technologies. Growing adoption of point-of-care testing and home test kits further accelerates this trend, contributing to a larger market share in diagnostics.
The USA is the dominant market for lipid profile testing due to the country’s high burden of lifestyle diseases, particularly heart disease, diabetes, and hypertension. The regions with the highest concentration of diagnostic labs and healthcare providers include major metropolitan areas such as New York, Los Angeles, and Chicago. These cities are home to large, diverse populations with high rates of cardiovascular-related diseases. The dominance is also attributed to robust healthcare infrastructure, strong government support for health screenings, and high healthcare spending in urban areas, making them key drivers of the lipid profile testing market.
Market Segmentation
By Testing Type
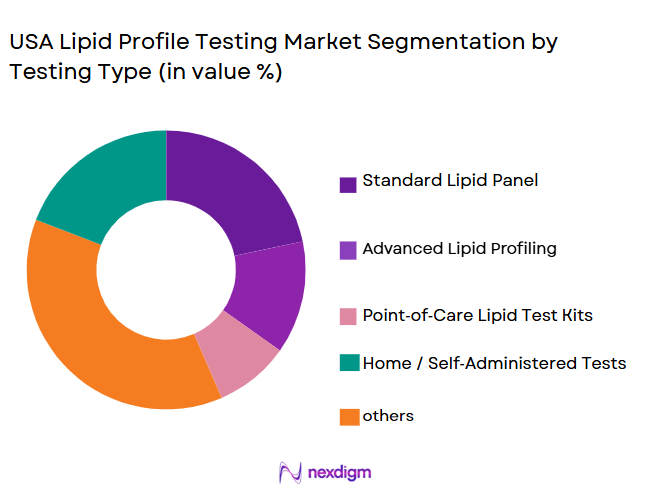
The lipid profile testing market is segmented by test type into standard lipid panels, advanced lipid profiling, and point-of-care lipid tests. The standard lipid panel is the dominant segment, largely due to its well-established clinical use for routine health checks. This test typically includes total cholesterol, LDL, HDL, and triglycerides, which provide critical insights into cardiovascular health. Hospitals and diagnostic centers predominantly offer this test due to its accuracy and ability to identify risks related to heart disease. This sub-segment holds the largest share because of its affordability, clinical validity, and essential role in preventive healthcare.
By End-User
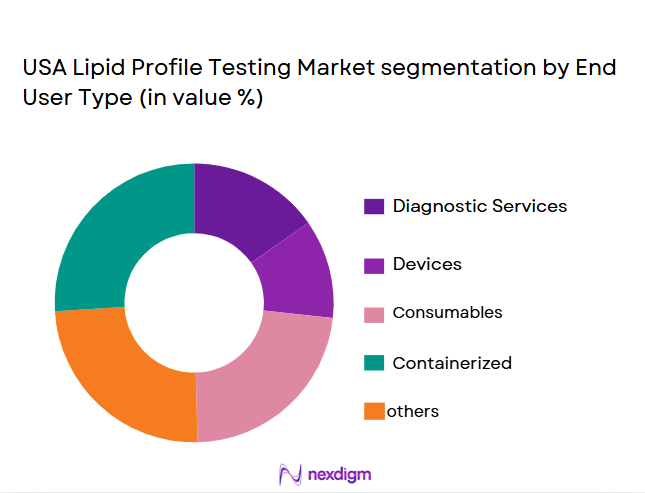
The market is further segmented by end-user into hospitals, clinics, laboratories, and home testing platforms. Among these, hospitals dominate the market due to their capacity for handling high volumes of lipid profile tests, as well as their involvement in critical care where lipid profile testing is routinely used for early disease detection and risk management. Hospitals also benefit from stronger reimbursement mechanisms and large-scale testing infrastructure, enabling them to offer these services at scale to patients. This sub-segment holds the largest market share, owing to hospital-centric care models and the integration of lipid testing within comprehensive health screening protocols.
Competitive Landscape
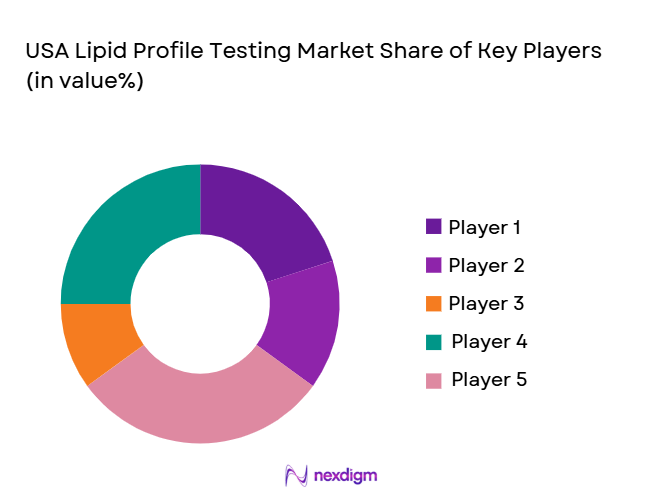
The USA Lipid Profile Testing market is highly competitive, with several major players dominating the diagnostic and testing landscape. Key players include diagnostic giants like Abbott Laboratories, Quest Diagnostics, LabCorp, Roche Diagnostics, and Siemens Healthineers. These companies leverage established brands, extensive distribution networks, and strategic partnerships with healthcare providers to maintain dominance in the market. Their market leadership is further strengthened by continuous innovations in testing technologies, including point-of-care solutions and AI-driven diagnostics.
| Company Name | Establishment Year | Headquarters | Technology Innovation | Test Offerings | Market Penetration | Revenue |
| Abbott Laboratories | 1888 | Chicago, USA | ~ | ~ | ~ | ~ |
| Quest Diagnostics | 1961 | Secaucus, NJ, USA | ~ | ~ | ~ | ~ |
| LabCorp | 1978 | Burlington, NC, USA | ~ | ~ | ~ | ~ |
| Roche Diagnostics | 1896 | Basel, Switzerland | ~ | ~ | ~ | ~ |
| Siemens Healthineers | 1847 | Erlangen, Germany | ~ | ~ | ~ | ~ |
USA Lipid Profile Testing Market Analysis
Growth Drivers
Urbanization
Indonesia’s rapid urbanization has significantly increased demand for comprehensive air quality monitoring as population density rises in large metropolitan zones. Official estimates show that over ~% of Indonesia’s population resides in urban areas in 2024, marking a continual migration from rural regions and placing intense pressure on urban infrastructure and environment systems. The Jakarta metropolitan area alone houses over ~ million people, accounting for roughly ~% of the nation’s urban population and exacerbating traffic congestion, energy consumption, and pollutant emissions in this region. These urban dynamics drive the need for expanded air quality monitoring to manage escalating pollution levels and protect public health within dense city environments.
Industrialization
Indonesia’s ongoing industrial development contributes major impetus to air quality monitoring system adoption due to intensified emissions from manufacturing and energy sectors. According to the World Bank, manufacturing accounted for around ~% of the value added to the economy in 2024, reflecting a substantial industrial base that releases pollutants requiring continuous tracking. Industrial expansion in sectors such as power generation, metal processing, and transportation fuels airborne particulate matter and gases, especially around Java and industrial corridors. Regular monitoring enables regulatory oversight, helps ensure compliance with environmental standards, and assists businesses in identifying emission hotspots for mitigation.
Restraints
High Initial Costs
Deploying advanced air quality monitoring systems incurs substantial upfront investment that restrains widespread adoption across Indonesia, particularly in smaller cities and rural regions. Reference‑grade monitoring stations that measure PM2.5, PM10, NO₂ and other pollutants require costly sensors, calibration tools, and data infrastructure. The procurement and installation of these stations can run into tens of millions of Indonesian Rupiah per unit, making deployment challenging for local governments with limited budgets. These high capital costs are compounded by expenses related to ongoing maintenance contracts, sensor recalibration, and data transmission systems, slowing efforts to establish a dense and comprehensive monitoring network nationwide.
Technical Challenges
Technical challenges pose significant barriers to effective air quality monitoring in Indonesia due to the complexity of ensuring data accuracy, consistency, and spatial coverage. Monitoring stations often rely on sophisticated instruments that require precise calibration and stable power sources, which can be unreliable in remote or under‑resourced areas. Additionally, variations in pollutant dispersion, climate conditions such as the El Niño effect, and frequent haze events from peatland fires further complicate measurement accuracy. Integrating and standardizing data from multiple types of monitoring units — reference‑grade, low‑cost, and mobile devices — adds complexity to the national system and may hinder timely and actionable environmental insights.
Opportunities
Technological Advancements
Advancements in sensing technologies and digital data platforms present significant opportunities to enhance Indonesia’s air quality monitoring capabilities. Emerging IoT‑enabled sensors, low‑cost monitoring units, and AI‑driven analytics can improve spatial coverage and provide real‑time insights into pollutant concentrations across metropolitan and regional areas. These technologies enable more granular tracking of PM2.5 and gaseous pollutants, facilitating localized mitigation strategies by urban planners and environmental agencies. Integration of sensor networks with remote sensing, satellite imagery, and advanced data processing platforms can generate richer environmental datasets, supporting decision‑making and public transparency.
International Collaborations
International collaborations offer vital support for expanding and refining Indonesia’s air quality monitoring infrastructure. Global partnerships can bring technical expertise, funding, and best practices for system deployment and data management. Collaborative engagements with agencies such as the World Bank, UN organizations, and international monitoring bodies enable capacity building and technology transfer. These joint efforts facilitate standardized monitoring frameworks, enhance the reliability of data collection, and help Indonesia align with global air quality benchmarks. In turn, such international involvement attracts foreign investments and supports policy development critical to long‑term environmental sustainability.
Future Outlook
Over the next five years, the USA Lipid Profile Testing market is expected to experience steady growth driven by continuous advancements in testing technology, particularly the rise of point-of-care devices and home testing kits. Increased public and healthcare provider focus on cardiovascular disease prevention, alongside government initiatives for routine health screenings, will further spur demand. Additionally, the growing emphasis on personalized medicine and preventive healthcare will likely drive market expansion, presenting new opportunities for players to develop targeted, more efficient testing solutions. The market’s evolution will also benefit from broader adoption of digital health and remote monitoring solutions.
Major Players
- Abbott Laboratories
- Quest Diagnostics
- LabCorp
- Roche Diagnostics
- Siemens Healthiness
- Thermo Fisher Scientific
- Beckman Coulter
- Bio-Rad Laboratories
- Nova Biomedical
- PTS Diagnostics
- Everly well, Inc.
- Hologic, Inc.
- Danaher Corporation
- Philips Healthcare
- Arkray, Inc.
Key Target Audience
- Healthcare Providers
- Investment and Venture Capitalist Firms
- Government and Regulatory Bodies
- Health Insurance Companies
- Medical Device Manufacturers
- Pharmaceutical Companies
- Medical Equipment Distributors
- Pharmacy Chains and Retail Health Clinics
Research Methodology
Step 1: Identification of Key Variables
The initial phase involves identifying the core variables influencing the USA Lipid Profile Testing market. This includes analyzing major stakeholders such as healthcare providers, diagnostic labs, and insurance companies. Secondary research will help gather market-level insights while primary research will validate findings through expert interviews and consultations.
Step 2: Market Analysis and Construction
This phase focuses on collecting historical data to understand market penetration, the growth of point-of-care tests, and the role of hospitals versus labs. Analyzing customer behavior, test frequency, and payment models will provide the foundation for market predictions.
Step 3: Hypothesis Validation and Expert Consultation
A set of market hypotheses will be tested via in-depth interviews with industry experts from diagnostics, healthcare management, and regulatory bodies. This qualitative data will help refine estimates and validate market assumptions.
Step 4: Research Synthesis and Final Output
After validation, research will be synthesized into actionable insights for market stakeholders. The final report will offer a thorough analysis of current trends, competitive analysis, and future market opportunities.
- Executive Summary
- Research Methodology (Market Definitions and Assumptions, Regulatory Benchmarks Data Sources & Triangulation, Estimation Model, Forecasting Approach)
- Market Definition & Clinical Context
- Key Clinical Indications
- Role in National Health Guidelines
- Historical Progression & Drivers
- Epidemiology of Lipid Disorders in the US
- Preventive Care Coverage & Reimbursement Influence
- Traditional Lab vs. Point‑of‑Care Dynamics

- Growth Drivers
Rising Cardiovascular Disease Prevalence
Preventive Healthcare Emphasis
Digital & Connected Diagnostics - Market Challenges
Reimbursement Variability (Medicare/Private Payers)
Regulatory Complexity
Test Standardization Challenges - Opportunities
AI‑Enabled Diagnostics & Predictive Risk Models
Expansion of Home Testing / Self‑Monitoring Solutions
Partnerships with Telehealth Providers - Trends & Innovations
Portable/POC Lipid Testing Adoption
Connectivity (Smartphone Analytics, Cloud Reporting)
Integration with Population Health Platforms - Regulatory & Quality Framework
FDA Regulatory Pathways
Quality & Compliance Standards
CLIA & CAP Implications
- Market Size Actuals 2019–2024
- Total Revenue & Test Volume 2019–2024
- Unit Price Trends 2019–2024
- Revenue by Test Modality 2019–2024
- Central Clinical Laboratories 2019–2024
- By Test Type (in Value %)
Standard Lipid Panel
Advanced Lipid Profiling
Point‑of‑Care Lipid Test Kits
Home / Self‑Administered Tests - By Product & Service Type (in Value %)
Diagnostic Services
Devices
Consumables - By End‑User (in Value %)
Hospital & Health Systems
Independent Diagnostic Labs
Primary Care & Specialty Clinics
Retail Pharmacies & Home Testing Platforms - By Distribution Channel (in Value %)
Clinical/Institutional Channel
E‑Commerce & Retail Distribution
Direct‑to‑Consumer Platforms - By Application (in Value %)
Routine Health Screening
Cardiometabolic Risk Monitoring
Chronic Disease Management
Research & Clinical Trials
- Market Share – Value & Volume (Major Players)
- Cross‑Comparison Parameters
(Product Portfolio Breadth , Channel Penetration
Reimbursement Coverage Footprint, Analytical Accuracy & Turnaround Time Installation Base , Consumables Yield & Repeat Revenue Streams Strategic Partnerships & Health System Integrations, Innovation Index ) - Company SWOT Profiles of Major Players
- Regional Performance Within the USA
- Detailed Company Profiles
- Abbott Laboratories
- Quest Diagnostics
- Labcorp
- Boston Heart Diagnostics
- Thermo Fisher Scientific
- Roche Diagnostics
- Beckman Coulter
- Siemens Healthineers
- Nova Biomedical
- Everlywell, Inc.
- PTS Diagnostics
- Eurofins Scientific
- Danaher Corporation (Beckman & others)
- Bio‑Rad Laboratories
- Hologic, Inc.
- Testing Frequency by Demographic Segment
- Physician & Clinical Adoption Patterns
- Patient Awareness & Self‑Monitoring Trends
- Cost Sensitivity & Insurance Dynamics
- By Value 2026-2030
- Service Revenue 2026-2030
- Devices & Consumables Revenue 2026-2030
- By Volume 2026-2030
- Total Tests Performed
- Device Install Base Growth


 Request a Sample
 Ask for Customization
 Get a Quote
 Enquire Now