
 Download PDF
Market Overview
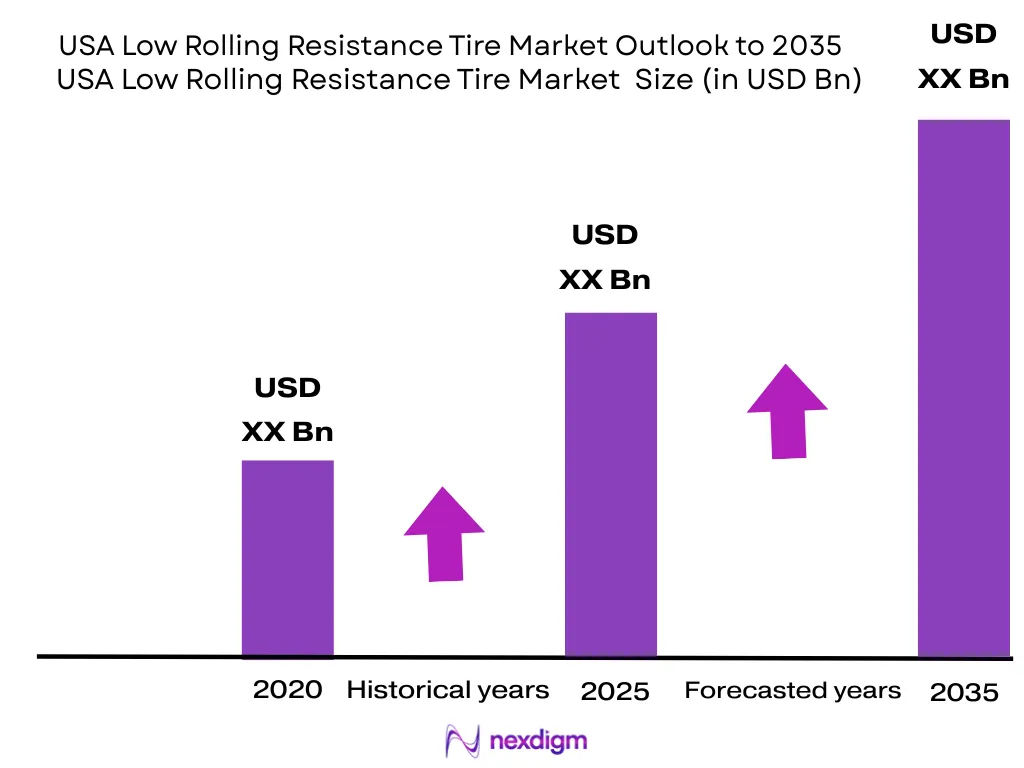
The USA Low Rolling Resistance Tire Market is valued at approximately ~ billion, compared with ~ billion in the preceding reporting period. Demand is supported by total U.S. tire shipments increasing from 331.9 million units to 338.9 million units. Replacement passenger-tire shipments reached 222.3 million units, light-truck replacements reached 36.3 million units, and replacement truck tires reached 23.4 million units, creating a substantial addressable base for fuel-efficient tire technologies.
California, Texas, Florida and major Midwest freight states dominate the USA Low Rolling Resistance Tire Market because they combine large vehicle populations, high annual mileage, extensive tire-dealer networks and major logistics activity. California also had approximately 1,256,646 registered light-duty electric vehicles, while Florida had 254,878 units, strengthening demand for range-efficient EV tires. Texas, California and freight-intensive Midwest corridors support commercial adoption through long-haul trucking, fleet procurement and EPA SmartWay-qualified products.
Market Segmentation
By Vehicle Type
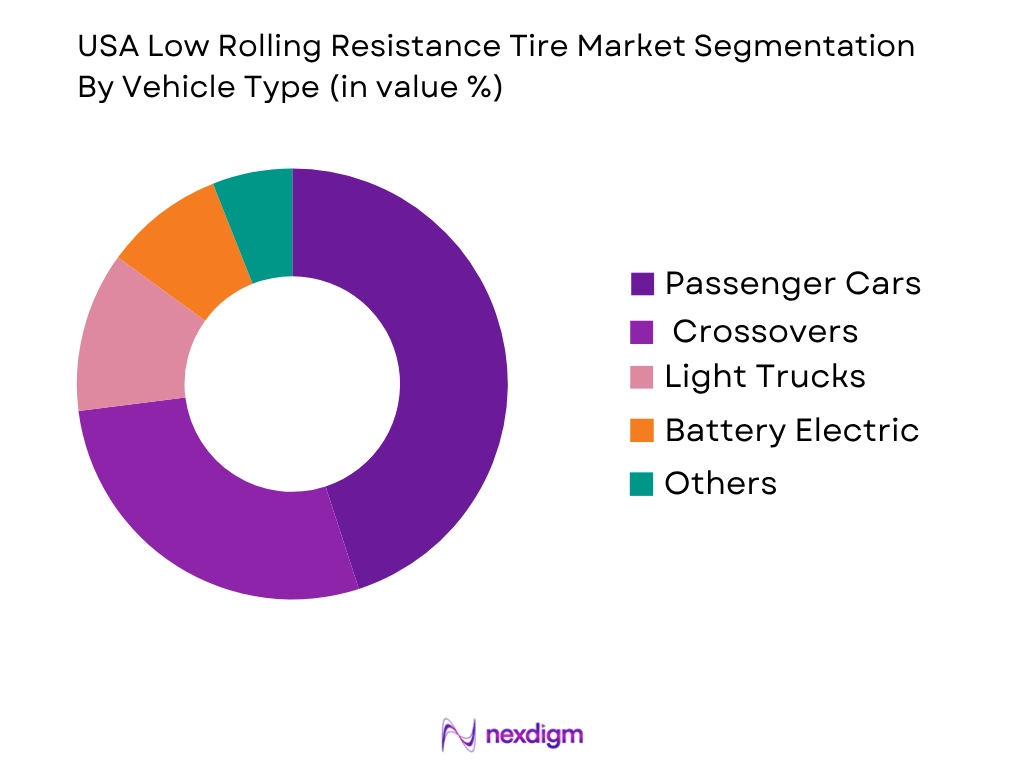
The USA Low Rolling Resistance Tire Market is segmented into passenger cars, SUVs and crossovers, pickup trucks and light trucks, battery electric and hybrid vehicles, light commercial vehicles, and medium- and heavy-duty commercial vehicles. Passenger cars hold the dominant market share, supported by the scale of the U.S. passenger vehicle parc and annual replacement demand.
Passenger replacement-tire shipments reached 222.3 million units, substantially exceeding light-truck and commercial truck categories. Passenger owners increasingly encounter low rolling resistance tires through original-equipment fitments, particularly on hybrid, electric and fuel-efficient compact vehicles. The category also benefits from widespread availability through national tire retailers, automotive service chains, warehouse clubs and online channels. Passenger products commonly balance rolling resistance with wet braking, all-season traction, noise, ride comfort and mileage warranties, making them accessible to mainstream motorists rather than only efficiency-focused users.
By Sales Channel
The USA Low Rolling Resistance Tire Market is segmented into replacement tire dealers, original-equipment manufacturers, automotive service centers, warehouse clubs and mass merchandisers, online tire retailers, and commercial fleet-direct channels. Replacement tire dealers hold the dominant market share, because tire replacement volumes are significantly larger than original-equipment shipments and consumers frequently depend on dealer recommendations when selecting a tire.
Independent and national dealers maintain multiple brands, sizes and price tiers, allowing them to match low rolling resistance products with vehicle fitment, mileage requirements, climate and budget. Dealers also influence whether motorists retain an OEM-equivalent efficiency specification or switch to a conventional replacement tire. Their role includes installation, balancing, alignment, rotation, pressure maintenance and warranty support. Commercial dealers additionally manage fleet casing programs, roadside services, retreading and EPA SmartWay-qualified tire selection. Online platforms are expanding, but installation remains linked to physical dealer networks.

Competitive Landscape
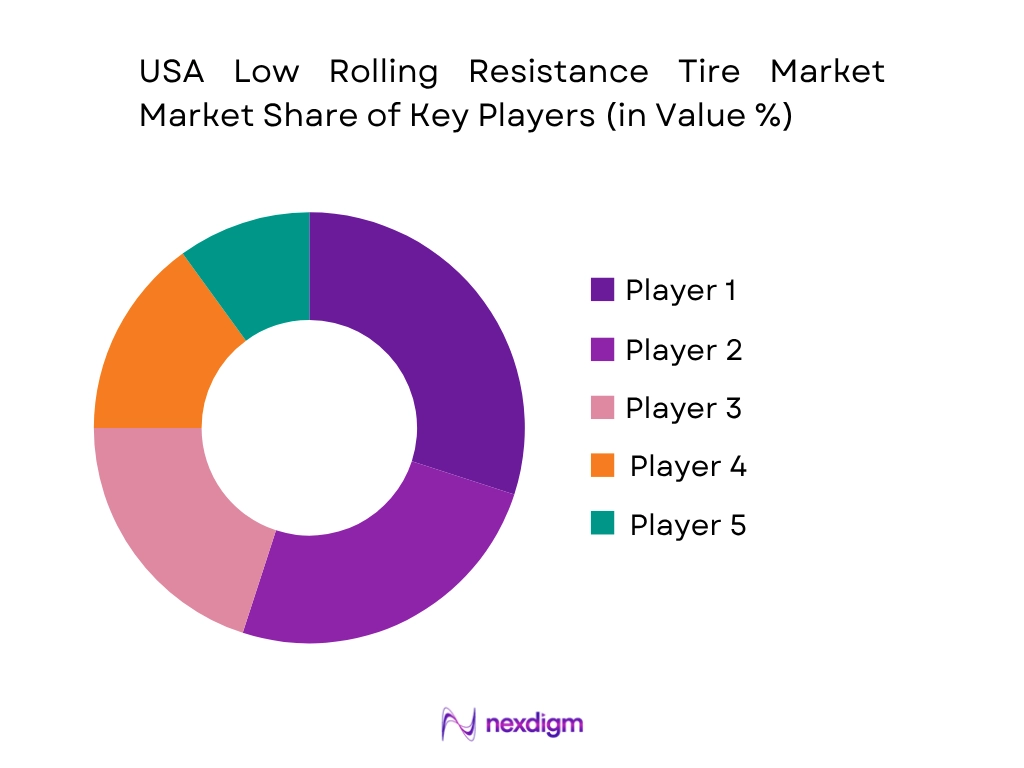
The USA Low Rolling Resistance Tire Market is led by major global manufacturers with extensive original-equipment relationships, replacement portfolios, domestic manufacturing and commercial fleet capabilities. Michelin, Bridgestone, Goodyear, Continental and Pirelli compete through proprietary tread compounds, vehicle-specific homologation, EV tire platforms, mileage warranties and dealer coverage. Competition is not based solely on achieving lower rolling resistance; manufacturers must simultaneously deliver wet traction, noise control, durability, high-load performance and commercially acceptable replacement intervals.
| Company | Establishment Year | U.S. Headquarters | Core LRR Applications | OEM Fitment Capability | Replacement Channel Reach | EV Tire Capability | Commercial Fleet Offering | Sustainability and Materials Position |
| Michelin North America | 1889 | Greenville, South Carolina | ~ | ~ | ~ | ~ | ~ | ~ |
| Bridgestone Americas | 1931 group heritage | Nashville, Tennessee | ~ | ~ | ~ | ~ | ~ | ~ |
| Goodyear Tire & Rubber Company | 1898 | Akron, Ohio | ~ | ~ | ~ | ~ | ~ | ~ |
| Continental Tire the Americas | 1871 | Fort Mill, South Carolina | ~ | ~ | ~ | ~ | ~ | ~ |
| Pirelli Tire North America | 1872 | Rome, Georgia | ~ | ~ | ~ | ~ | ~ | ~ |
USA Low Rolling Resistance Tire Market Analysis
Growth Drivers
Large Replacement-Tire Base and High Vehicle-Mileage Exposure
The scale of U.S. road travel and tire replacement activity is a core driver of low rolling resistance tire demand. The U.S. Tire Manufacturers Association projected 338.9 million passenger, light-truck and truck tire shipments in 2024, compared with 331.9 million units in 2023. Replacement demand represented the principal volume pool, including 222.3 million passenger tires, 36.3 million light-truck tires and 23.4 million truck tires. For 2025, replacement shipments were expected to increase by another 4.4 million units, creating repeated opportunities for dealers and fleets to substitute conventional products with more energy-efficient alternatives. Federal Highway Administration records also show that U.S. vehicles collectively travelled more than 3.2 trillion miles during 2024, exposing tires to sustained deformation, heat generation and tread wear. The efficiency impact becomes commercially relevant across such a large mileage base because NHTSA estimates that reducing tire rolling resistance by 10% can improve vehicle fuel economy by approximately 1%–2% when other operating conditions remain comparable. The benefit applies not only to fuel expense but also to national energy consumption and vehicle emissions. U.S. Energy Information Administration data indicate that motor gasoline demand remained near 9 million barrels per day during 2024 and 2025, showing that internal-combustion vehicles continue to represent a substantial energy-consumption base. Macroeconomic conditions support ongoing vehicle usage: World Bank data recorded U.S. real GDP growth of approximately 2.8% in 2024, while the IMF projected 2.3% growth in 2026 for a population of 342.942 million people. This combination of high replacement volume, extensive annual mileage and continued economic activity supports low rolling resistance adoption across passenger cars, SUVs, pickups, delivery vehicles and commercial fleets.
OEM Fuel-Efficiency Requirements and Electrified-Vehicle Expansion
Vehicle manufacturers increasingly use low rolling resistance tires to improve certified energy performance without changing the core propulsion system. NHTSA states that original-equipment manufacturers are progressively specifying low rolling resistance products for new vehicles, making tire efficiency an embedded component of vehicle-level fuel-economy and emission strategies. This is particularly relevant as the U.S. light-duty fleet becomes more electrified. Department of Energy registration data indicate approximately 5.69 million light-duty battery electric vehicles and 1.77 million plug-in hybrid vehicles operating nationally in the latest available registration dataset. Cumulative new light-duty plug-in vehicle sales had already reached 4.7 million units before the 2024 sales cycle, while U.S. hybrid sales reached nearly 1.2 million vehicles in the preceding annual period. Electric vehicles increase the commercial importance of tire efficiency because rolling losses directly affect usable battery range. At the same time, battery weight, high torque and larger wheel diameters increase tire-load and durability requirements, encouraging development of high-load, low-noise and range-optimized products. The wider tire market provides the scale needed to commercialize these technologies: passenger original-equipment and replacement shipments together account for well above 250 million tires annually, while light-truck applications add tens of millions of units. Corporate and government fleets are also evaluating vehicle energy use more systematically as electrified assets enter delivery, municipal and rental operations. The macroeconomic backdrop remains supportive of vehicle investment and manufacturing, with World Bank data showing 2.8% U.S. GDP growth in 2024 and the IMF projecting a national population of 342.942 million in 2026. Low rolling resistance tires therefore function as both a regulatory-support technology for manufacturers and a range-management tool for a rapidly expanding electrified fleet.
Market Challenges
Balancing Rolling Resistance with Wet Grip, Tread Life and EV Durability
Reducing tire energy loss without weakening safety or durability remains the principal technical challenge in the USA Low Rolling Resistance Tire Market. Rolling resistance is influenced by tread-compound hysteresis, sidewall flex, tire mass, inflation pressure and contact-patch design. Lowering deformation-related energy loss can improve vehicle efficiency, but excessive optimization can compromise wet braking, snow traction, ride comfort, puncture resistance or tread life. The challenge is amplified by the scale and diversity of U.S. replacement demand. USTMA projected 222.3 million replacement passenger tires, 36.3 million replacement light-truck tires and 23.4 million replacement truck tires in 2024, covering vehicles with significantly different weights, speed profiles, climates and load requirements. Passenger products may need all-season capability across temperature extremes, while pickup and SUV tires must support towing, payload and larger rim diameters. Commercial products must maintain casing integrity for high-mileage use and potential retreading. Electric vehicles add further complexity: the latest federal registration dataset identifies approximately 5.69 million battery electric vehicles, whose battery mass and immediate torque can accelerate tread wear. A tire that improves range but requires substantially earlier replacement may fail to deliver the expected lifecycle benefit. NHTSA estimates that a 10% reduction in rolling resistance can improve vehicle fuel economy by 1%–2%, but this benefit assumes appropriate inflation, alignment and product fitment. Manufacturers must therefore validate rolling resistance alongside wet traction, high-speed endurance, load capacity, noise and mileage performance. World Bank data showing 2.8% U.S. economic growth in 2024 indicate a large, active mobility market, but also one in which product failure or inadequate durability can create widespread warranty exposure. Successful products must deliver measurable efficiency without asking consumers or fleets to accept reduced safety or shortened service life.
Limited Consumer Comparability and Dependence on Correct Tire Maintenance
Consumer difficulty in identifying and maintaining efficient tires can restrict low rolling resistance adoption in the replacement channel. Unlike vehicle fuel-economy labels, rolling resistance performance is not consistently presented to U.S. tire buyers through a simple, universally recognized retail metric. Consumers typically compare brand, price tier, mileage warranty, wet traction, snow capability and online reviews, while rolling resistance may receive limited attention unless the vehicle is electric, hybrid or originally fitted with an efficiency-focused tire. This information gap is material because replacement channels accounted for approximately 282 million passenger, light-truck and truck tires in 2024, far exceeding original-equipment shipment volumes. Dealers therefore determine whether many vehicles retain an OEM-equivalent efficiency specification or move to products selected primarily for price, availability or tread-life claims. Maintenance behavior creates another challenge. Low rolling resistance performance depends on correct inflation, wheel alignment, rotation and load management. Underinflation increases tire deformation and heat, reducing efficiency regardless of compound technology. The U.S. travelled more than 3.2 trillion vehicle-miles in 2024, meaning relatively small maintenance deficiencies can influence energy use across a very large operating base. Product proliferation also complicates dealer inventory and recommendations: the market spans passenger, SUV, light-truck, EV, winter, all-weather and commercial sizes, while replacement passenger shipments alone exceeded 220 million units. Macroeconomic conditions can intensify value-focused purchasing. The IMF reported U.S. economic growth of 2.0% in 2025 and projected 2.3% in 2026, while consumer prices were projected to rise by 3.2% in 2026. In this environment, customers may prioritize immediate affordability over lifetime energy efficiency. Manufacturers and retailers must therefore improve fitment tools, efficiency explanations, tire-pressure education and dealer training to translate technical performance into a credible purchasing benefit.
Market Opportunities
EV-Specific High-Load, Low-Noise and Range-Optimized Tire Platforms
The expanding U.S. electric-vehicle fleet creates a significant opportunity for tire manufacturers to develop products that combine lower rolling resistance with high load capacity, noise reduction and improved wear resistance. Federal alternative-fuel data indicate approximately 5.69 million registered light-duty battery electric vehicles and 1.77 million plug-in hybrid vehicles in the latest available national dataset. California remains the largest state market, followed by Florida and Texas, creating concentrated demand for replacement inventory, trained dealers and mobile installation. EV tires operate under requirements that differ from conventional passenger products. Battery packs increase vehicle mass, instant torque can accelerate tread wear, and quiet electric powertrains make tire-generated noise more noticeable. Rolling resistance also has a direct relationship with usable driving range, making efficiency a visible ownership consideration rather than only a fuel-saving feature. The opportunity spans sedans, crossovers, electric SUVs, pickups and delivery vans, each requiring different load indices and tread architectures. U.S. replacement passenger and light-truck shipments totaled approximately 258.6 million units in 2024, giving manufacturers an extensive channel through which EV-derived technologies can eventually migrate into mainstream products. Charging and registration growth also support future service demand, while digital fitment tools can help consumers identify EV-approved or high-load alternatives. Current macroeconomic indicators provide a substantial commercial foundation: the IMF recorded a U.S. population of 342.942 million and projected 2.3% GDP growth in 2026, while BEA reported consumer spending and investment contributing to economic expansion during the first half of 2026. Manufacturers that demonstrate range performance alongside wet braking, low noise and competitive tread life can secure OEM homologation, premium replacement positioning and fleet contracts. The opportunity is strongest for vehicle-specific platforms rather than generic “EV-ready” labeling without validated load and efficiency performance.
SmartWay Commercial Tires, Retreads and Connected Fleet Management
Commercial trucking provides a substantial opportunity for low rolling resistance tires because fleets evaluate products through fuel use, casing durability, retreadability, uptime and operating performance over high annual mileage. USTMA projected 23.4 million replacement truck tire shipments in 2024, following an increase of approximately 2.6 million units from the preceding year. Its 2025 forecast subsequently indicated that replacement truck shipments could rise by another 7.9%, demonstrating continued commercial demand despite weaker original-equipment truck volumes. EPA’s SmartWay program maintains verified lists of new and retread low rolling resistance technologies for specified axle positions on Class 8 long-haul tractors and trailers. This creates a government-recognized framework through which fleet managers can identify products designed to reduce fuel consumption and emissions. The opportunity extends beyond tire manufacturing. Fleets require pressure monitoring, automatic inflation, alignment services, casing tracking, roadside support, retread management and performance reporting to retain the benefits of efficient tires throughout their service life. FHWA’s 2025 travel outlook projects combination-truck vehicle miles increasing by 0.9% annually and single-unit truck mileage increasing by 2.0% annually through the long-term forecast period. Although these figures are projections, current commercial demand is supported by the more than 3.2 trillion vehicle-miles travelled across U.S. roads in 2024 and continued freight activity. The IMF projected 2.3% U.S. GDP growth in 2026, supporting goods movement, logistics and fleet utilization. Manufacturers can capture this opportunity by expanding SmartWay-verified steer, drive, trailer and retread portfolios, while dealers can offer bundled tire-management contracts. Connected sensors and automated inspections can further reduce underinflation, irregular wear and premature casing loss, converting low rolling resistance tires from a standalone product into a managed fleet-efficiency service.
Future Outlook
The USA Low Rolling Resistance Tire Market is forecast to expand at approximately % CAGR during the forecast period. Growth will be supported by continued replacement-tire demand, vehicle fuel-efficiency requirements, rising electric-vehicle ownership and commercial fleet pressure to reduce fuel consumption. The future market will move from a niche “fuel-saving tire” category toward broader integration of low rolling resistance technology across mainstream passenger, SUV, EV and commercial products. Manufacturers will increasingly optimize complete performance packages rather than promote rolling resistance as a standalone feature. Replacement demand provides a stable platform. U.S. replacement shipments included 222.3 million passenger tires, 36.3 million light-truck tires and 23.4 million truck tires. The large replacement pool creates opportunities to migrate consumers from conventional products toward higher-efficiency tires as vehicles age and original tires wear out. Electric vehicles will increase the technical importance of rolling resistance. EVs are highly sensitive to tire energy loss because tire efficiency directly affects usable driving range. They also place greater loads on tires because of battery weight and can accelerate wear through high instantaneous torque. Future products must therefore combine low hysteresis with reinforced load capacity, low noise, strong wet grip and improved tread durability.
Major Players
- Michelin North America
- Bridgestone Americas
- The Goodyear Tire & Rubber Company
- Continental Tire the Americas
- Pirelli Tire North America
- Hankook Tire America
- Yokohama Tire Corporation
- Sumitomo Rubber North America
- Toyo Tire U.S.A.
- Kumho Tire U.S.A.
- Nokian Tyres
- Giti Tire USA
- Sailun Tire Americas
- Nexen Tire America
- Triangle Tire USA
Key Target Audience
- Passenger, light-truck and commercial tire manufacturers
- Automotive OEMs and electric-vehicle manufacturers
- National tire dealers and automotive service networks
- Commercial trucking, delivery and mobility fleets
- Tire distributors, warehouse clubs and online retailers
- Raw material, compound and tire-technology suppliers
- Investments and venture capitalist firms
- Government and regulatory bodies
Research Methodology
Step 1: Identification of Key Variables
The initial phase constructs an ecosystem map covering tire manufacturers, vehicle OEMs, raw-material suppliers, distributors, dealers, fleets, retreaders, recyclers and regulators. Key variables include tire shipments, vehicle parc, annual mileage, replacement cycles, rolling resistance performance, tire size, axle position, propulsion type and distribution channel.
Step 2: Market Analysis and Construction
Historical tire shipment, vehicle registration, EV adoption and commercial fleet information is compiled. Top-down analysis assesses total tire-industry revenue and efficient-tire penetration, while bottom-up analysis estimates demand using tire replacements per vehicle, application-specific fitment and average selling values.
Step 3: Supply-Side Assessment
Major manufacturers are evaluated by low rolling resistance portfolio, OEM contracts, U.S. production footprint, dealer reach, SmartWay verification, EV capability and sustainable-material development. Distributor inventories, online availability and commercial fleet programs are assessed to reconstruct organized supply.
Step 4: Demand-Side Assessment
Passenger motorists, EV owners, pickup drivers, commercial fleets and original-equipment buyers are analyzed according to annual mileage, fuel use, range sensitivity, tire replacement frequency and total cost of ownership. The analysis also examines dealer recommendations, consumer awareness and willingness to trade price for efficiency.

- Executive Summary
- Research Methodology (Market Definitions and Assumptions, Low Rolling Resistance Tire Qualification Criteria, Abbreviations, Market Sizing Approach, Top-Down Analysis, Bottom-Up Analysis, Tire Shipment Assessment, Vehicle Parc–Based Demand Modeling, OEM Fitment Assessment, Replacement Cycle Analysis, Fleet Demand Assessment, Primary Industry Interviews, Data Triangulation, Forecasting Framework, Limitations and Future Conclusions)

- Definition and Scope
- Market Evolution and Industry Genesis
- Timeline of Major Industry Developments
- Low Rolling Resistance Tire Technology Evolution
- Passenger, Light Truck and Commercial Tire Ecosystem
- OEM and Replacement Tire Market Structure

- Growth Drivers (Corporate Average Fuel Economy Requirements, Vehicle Emission Reduction, EV Range Optimization, Fuel Cost Management, High Annual Vehicle Mileage, Commercial Fleet Efficiency)
- Market Challenges (Wet-Grip Trade-Off, Tread-Life Balance, Consumer Awareness, Tire Maintenance, Raw Material Volatility, Product Differentiation)
- Market Opportunities (EV Tire Platforms, SmartWay Fleets, Wide-Base Tires, Retread Technology, Connected Tires, Sustainable Materials)
- Market Trends (Electrification, Larger Rim Diameters, Sustainable Materials, Smart Tires, Omnichannel Retailing, Fleet Digitization)
- Government Regulations (NHTSA Tire Fuel-Efficiency Information, EPA SmartWay Verification, FMVSS Compliance, CAFE Standards, Greenhouse Gas Rules, State Fleet Requirements)
- SWOT Analysis
Porter’s Five Forces Analysis
PESTLE Analysis

- By Market Value (2020-2025)
- By Tire Shipment Volume (2020-2025)
- By Original Equipment Tire Volume (2020-2025)

- By Tire Type (In Value %)
Passenger Car Tires
SUV and Crossover Tires
Light Truck Tires
Pickup Truck Tires
Medium Truck Tires
Heavy Truck and Bus Tires
Trailer Tires - By Vehicle Type (In Value %)
Passenger Cars
Sports Utility Vehicles
Crossovers
Pickup Trucks
Light Commercial Vehicles
Medium-Duty Trucks
Heavy-Duty Class 8 Trucks - By Sales Channel (In Value %)
Original Equipment Manufacturers
Automotive Dealerships
National Tire Dealer Chains
Independent Tire Dealers
Automotive Service Centers - By Distribution Geography (In Value %)
Northeast United States
Midwest United States
South United States
West United States

- Market Share of Major Players (By Value, Shipment Volume, Passenger Tires, Light Truck Tires, Commercial Tires, Distribution Channel)
- Cross Comparison Parameters (Low Rolling Resistance Product Portfolio Breadth, Passenger–SUV–Light Truck–Commercial Vehicle Coverage, OEM Fitment and Vehicle Homologation Portfolio, EPA SmartWay–Verified New and Retread Tire Presence, Rolling Resistance–Wet Grip–Tread-Life Performance Balance, EV High-Load–Range–Noise Optimization Capability, U.S. Manufacturing–Distribution–Dealer Network Reach, Sustainable Materials and Connected Tire Innovation)
- SWOT Analysis of Major Players
- Pricing Analysis by Tire SKU and Vehicle Application
- Detailed Profiles of Major Companies
Michelin North America
Bridgestone Americas
The Goodyear Tire & Rubber Company
Continental Tire the Americas
Pirelli Tire North America
Hankook Tire America
Yokohama Tire Corporation
Sumitomo Rubber North America
Toyo Tire U.S.A.
Kumho Tire U.S.A.
Nokian Tyres
Giti Tire USA
Sailun Tire Americas
Nexen Tire America
Triangle Tire USA

- Individual Passenger Car Owner Analysis
- SUV and Crossover Owner Analysis
- Pickup Truck Owner Analysis
- Electric Vehicle Owner Analysis
- Hybrid Vehicle Owner Analysis

- By Market Value (2026-2035)
- By Tire Shipment Volume (2026-2035)
- By Original Equipment Tire Volume (2026-2035)


 Request a Sample
 Ask for Customization
 Get a Quote
 Enquire Now