 Market Outlook to 2030")
 Market Outlook to 2030") Download PDF
Download PDF Download PDF
Market Overview
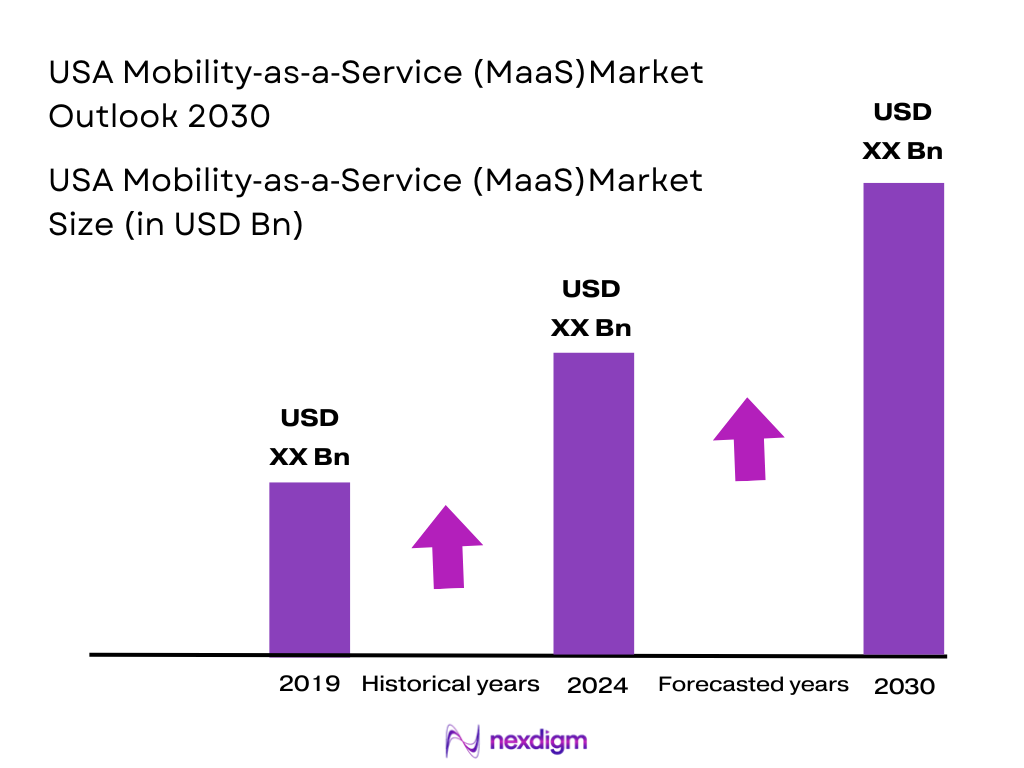
The USA Mobility-as-a-Service (MaaS) market is projected to be valued at USD ~ billion in 2024, driven by the rapid digitalization of the transportation sector and consumer preferences for on-demand, flexible transport solutions. The growth is supported by increasing urbanization, the expansion of shared mobility solutions, and government policies promoting sustainable transportation. With increasing penetration of smartphone-based transportation platforms and the push for eco-friendly solutions, the market is positioned to expand significantly. Furthermore, the rise in congestion pricing models, as well as regulatory changes favoring shared transportation, will further propel market growth.
Cities like New York, Los Angeles, and San Francisco dominate the USA MaaS market due to their dense populations, technological advancements, and progressive transport policies. These cities are early adopters of MaaS solutions, driven by both governmental incentives and consumer demand for alternative transport methods. Furthermore, the extensive integration of ride-hailing services, public transport systems, and autonomous vehicle trials in these urban centers has led to their dominance. The adoption of MaaS in these cities is further supported by high levels of investment in smart city initiatives, making them central hubs for MaaS growth in the U.S.
Market Segmentation
By Service Type
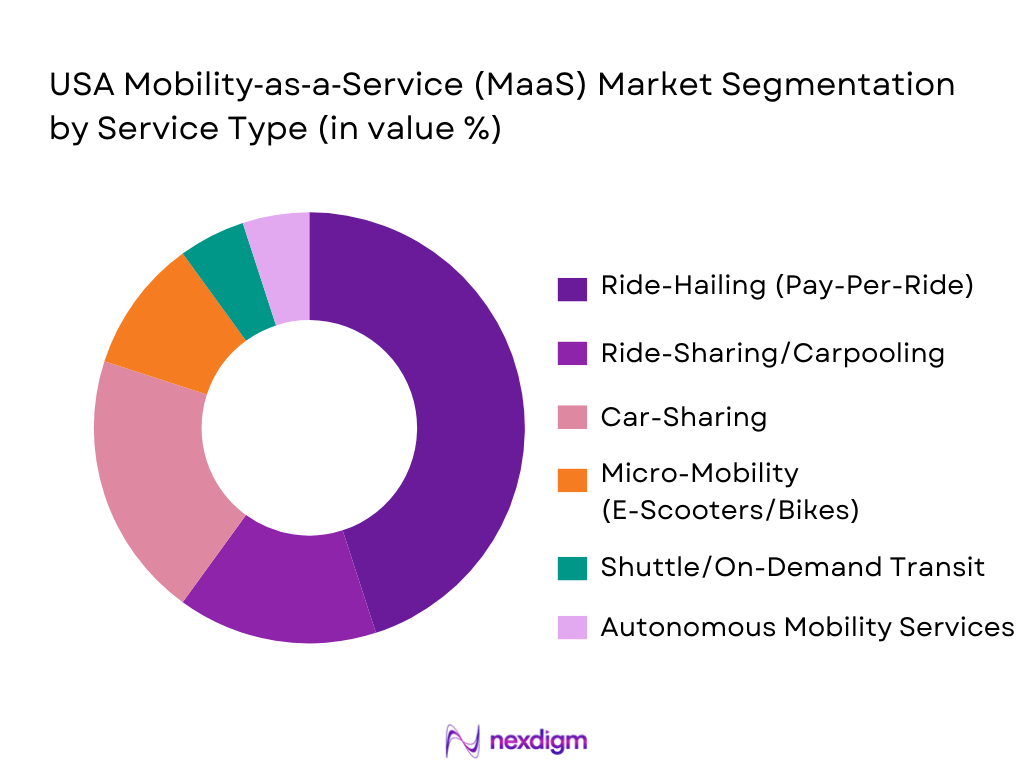
The USA MaaS market is segmented by service type, and it is predominantly driven by ride-hailing, micro-mobility, and car-sharing services. Ride-hailing services are the largest contributor to the market share as companies like Uber and Lyft continue to dominate the sector, making up a significant portion of the MaaS landscape. The growth of car-sharing platforms such as Zipcar, and the increasing adoption of electric scooter-sharing in urban areas, are further fueling the segment’s expansion.
By Region
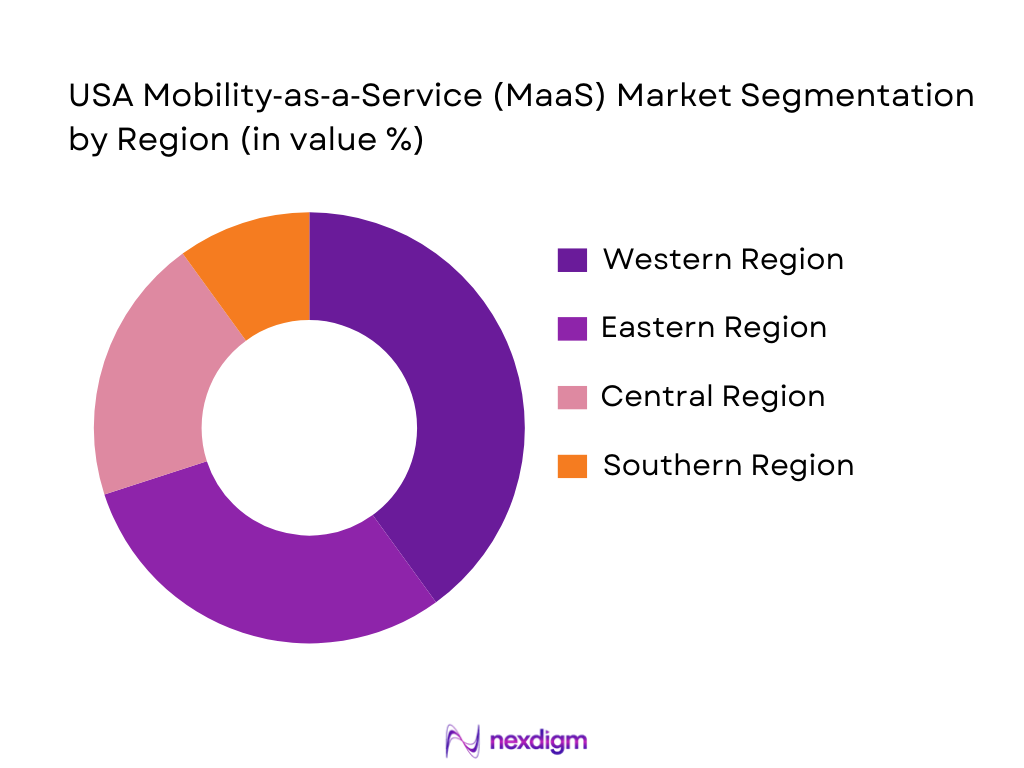
The market is also segmented by region into Central Region, Eastern Region, Western Region, and Southern Region. The Western region, which includes major urban centers such as San Francisco, Los Angeles, and Seattle, is a key contributor to the MaaS market due to its tech-driven environment and high demand for sustainable transportation solutions.
Competitive Landscape
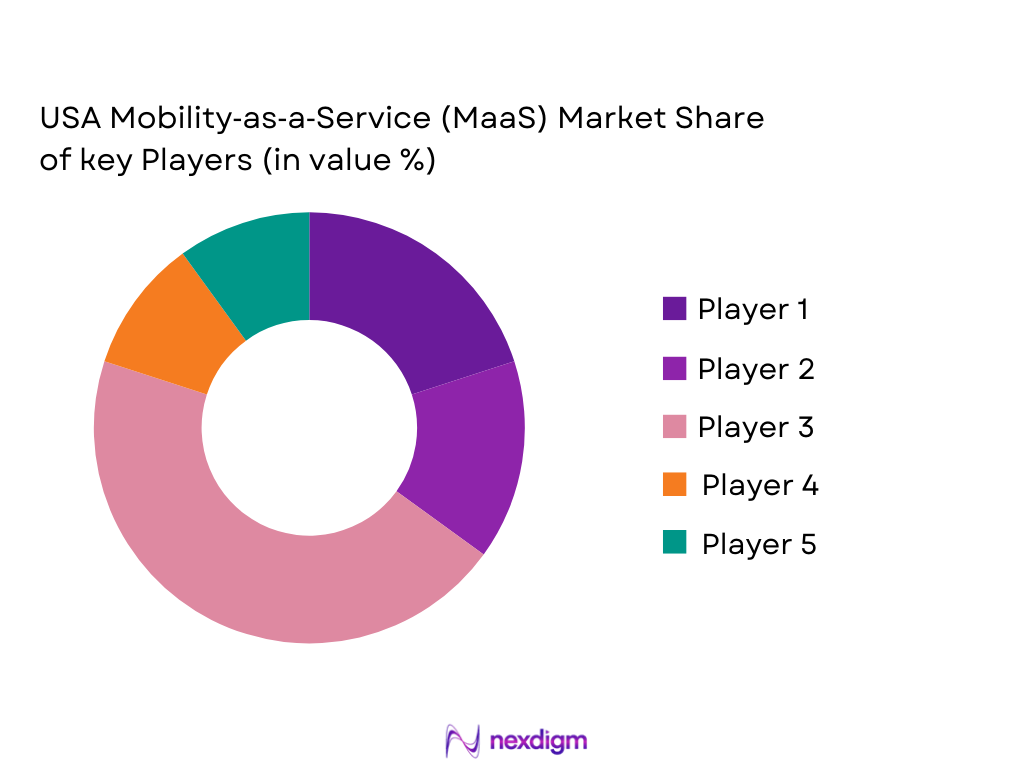
The USA MaaS market is highly competitive, with both established tech giants and emerging startups shaping the landscape. Major players in the market include Uber, Lyft, Waymo, and Via Transportation, alongside smaller regional players.
| Company | Establishment Year | Headquarters | Platform Type | Key Offerings | Market Focus |
| Uber | 2009 | San Francisco, USA | ~ | ~ | ~ |
| Lyft | 2012 | San Francisco, USA | ~
|
~
|
~
|
| Waymo | 2009 | Mountain View, USA | ~
|
~
|
~
|
| Via | 2012 | New York, USA | ~
|
~
|
~
|
| Getaround | 2009 | San Francisco, USA | ~
|
~
|
~
|
USA Mobility‑as‑a‑Service (MaaS) Market Analysis
Growth Drivers
Urbanization
Urbanization plays a crucial role in the expansion of the Mobility-as-a-Service (MaaS) market in the U.S., as cities continue to grow rapidly, and the demand for more sustainable transportation solutions increases. By 2024, the U.S. urban population is expected to surpass ~ million, with the metropolitan areas accounting for 83% of the national population, according to the U.S. Census Bureau. This surge in urban living fuels the demand for multimodal transportation options, which MaaS platforms provide, offering seamless integration of different transport services like ride-hailing, car-sharing, and micro-mobility. The growth in urban centers directly increases the adoption of MaaS solutions due to the high density of commuters and a shift towards shared and eco-friendly transport modes. The U.S. government’s increasing investments in sustainable transportation infrastructure further accelerate MaaS growth in these urban environments.
Industrialization
The rapid pace of industrialization, especially in cities like Houston, Texas, and Detroit, Michigan, is contributing to the demand for MaaS in the U.S. Industrial growth leads to higher demand for workforce transportation and logistics solutions. The total manufacturing output of the U.S. reached USD ~ trillion in 2024, according to the U.S. Bureau of Economic Analysis. As industries expand and more people commute to industrial zones, the need for efficient and affordable mobility solutions rises. MaaS platforms help meet this demand by offering on-demand transit options, shuttle services, and carpooling for industrial workers. Furthermore, as more industries adopt sustainability goals, MaaS provides a pathway to reduce their carbon footprints by promoting shared transport solutions, easing congestion, and improving air quality in industrial areas.
Restraints
High Initial Costs
High initial costs of developing and deploying Mobility-as-a-Service platforms present a significant restraint for widespread adoption in the U.S. MaaS platforms require substantial investments in infrastructure, technology, and partnerships with existing transport providers. The U.S. Department of Transportation (USDOT) estimates that the average cost to develop a full-fledged MaaS platform can range from USD ~ million to USD ~ million, depending on the scale of the city or region. These high upfront costs, especially local governments and smaller operators, can limit the pace at which MaaS is deployed in non-metro areas. Additionally, the cost of acquiring electric vehicles for MaaS fleets and establishing charging stations presents further financial barriers, particularly in a challenging post-pandemic economic recovery environment.
Technical Challenges
Technical challenges, including the integration of multiple transportation modes and the establishment of a seamless user experience, hinder the expansion of the MaaS market in the U.S. According to the National Institute of Standards and Technology (NIST), interoperability between different transport providers and platform technologies remains a significant barrier. Ensuring real-time data sharing, synchronized billing, and a unified user interface for diverse transport services is complex and costly. Moreover, cybersecurity threats pose a risk to the integrity of MaaS platforms, as the platforms collect vast amounts of sensitive user data. Ensuring these platforms are resilient and can operate smoothly across various cities, each with its own infrastructure and regulations, is a technical challenge that requires significant investment in R&D.
Opportunities
Technological Advancements
Technological advancements present significant opportunities for the growth of the MaaS market in the U.S., especially as autonomous vehicles (AVs), electric vehicles (EVs), and artificial intelligence (AI) continue to evolve. The U.S. electric vehicle market reached a sales volume of ~ vehicles in 2024, a ~ % increase , according to the U.S. Department of Energy. As EV infrastructure improves, integrating electric vehicles into MaaS platforms offers substantial growth potential. Furthermore, the development of AI-powered routing algorithms and autonomous vehicle fleets offers the opportunity to reduce costs, enhance efficiency, and improve the user experience. These technological advancements, combined with increasing government incentives for EV adoption and autonomous vehicle testing, provide a clear pathway for MaaS to evolve into a critical component of U.S. transportation systems.
International Collaborations
International collaborations present a significant opportunity to expand the U.S. MaaS market, particularly through partnerships with global leaders in mobility technology and sustainability. Companies like Uber and Lyft are already exploring strategic alliances with European MaaS providers to expand their offerings globally. Furthermore, the U.S. is in active discussions with European countries to adopt best practices for MaaS regulation and platform integration, as outlined by the European Commission’s initiative to create a unified MaaS framework. Such collaborations offer opportunities to bring cutting-edge mobility solutions, such as multimodal journey planners and integrated payment systems, to U.S. cities. These partnerships also help U.S. companies access advanced MaaS technologies, enabling them to expand service offerings and improve operational efficiency.
Future Outlook
Over the next 5 years, the USA MaaS market is expected to show significant growth, driven by continuous government support, advancements in transport technology, and increasing consumer demand for flexible and sustainable transportation solutions. The introduction of autonomous vehicles and the integration of EVs into MaaS platforms will further fuel the market’s expansion. Additionally, growing urban congestion and the shift towards shared mobility models are anticipated to drive further adoption of MaaS solutions.
Major Players in the Market
- Uber Technologies, Inc.
- Lyft, Inc.
- Waymo (Alphabet)
- Via Transportation
- Getaround
- Turo
- Zipcar (Avis)
- Bird
- Lime
- MaaS Global (Whim)
- Moovit
- Bridj
- Scoot Networks
- Revel Transit
- Curb Mobility
Key Target Audience
- Government Agencies (e.g., USDOT, FTA, State Transport Departments)
- Transportation Network Companies (TNCs)
- OEMs (Automobile Manufacturers)
- Investments and Venture Capitalist Firms
- Urban Mobility Planners and Municipalities
- Fleet Operators
- Smart City Developers
- Private Sector Corporations (Corporate Mobility Solutions Providers)
Research Methodology
Step 1: Identification of Key Variables
The initial phase involves gathering data on stakeholders in the USA MaaS market. This is done through secondary research and proprietary databases, focusing on key players and market size. The aim is to establish the critical factors driving the MaaS adoption in urban and suburban environments.
Step 2: Market Analysis and Construction
Historical data is compiled, evaluating past growth and trends in service adoption, user base expansion, and revenue generation. Insights are drawn from past MaaS deployment patterns to determine future projections.
Step 3: Hypothesis Validation and Expert Consultation
Experts from major MaaS providers are consulted to validate hypotheses and gain qualitative insights. These consultations focus on the technological and regulatory challenges shaping the market.
Step 4: Research Synthesis and Final Output
Final insights are gathered by engaging with multiple MaaS stakeholders, including fleet operators and tech platforms, to validate key assumptions and finalize the market’s growth trajectory.
- Executive Summary
- Research Methodology (Market Definitions and Assumptions, USA‑specific MaaS Taxonomy, Abbreviations, TAM/SAM/SOM Modeling, USA Regulatory Data Sources, Primary vs. Secondary Research Protocols, Forecasting Methodology, Bias Controls, Limitations)
- Strategic Concept of MaaS & Integration Framework
- Ecosystem Stakeholders (Platforms, Public Transit, OEMs, Fleet Providers, Tech Integrators)
- Market Genesis & Evolution in USA
- Institutional Infrastructure & Data Interoperability Architectures (API Standards, Payment Systems)
- Supply Chain & Mobility Value Chain
- Vehicle OEMs → Fleet Operators → Platforms → Users
- Data/AI Infrastructure → Real‑Time Optimization → Billing/Clearing Networks

- Growth Drivers
Urban Congestion & Modal Shift Index
Cost Differential: Vehicle Ownership vs MaaS Spend
Smartphone Penetration & Digital Payments
Sustainability & Zero‑Emission Zones
- Challenges & Market Frictions
Regulatory Heterogeneity Across States and Cities
Licensing, Insurance & Safety Compliance
Data Privacy & Cybersecurity Risks
- High‑Impact Trends
Multi‑Modal Trip Orchestration
AI‑Driven Predictive Routing & Dynamic Pricing
Integration of Autonomous Robotaxi Services
EV Adoption & Charging Infrastructure Partnerships
- Opportunity Spaces
Corporate MaaS Contracts
Public Transit Partnership & Subsidized MaaS
Last‑Mile Logistics Integration
Micro‑Subscription Models
- Policy & Regulatory Environment
Federal Transportation Policy (FTA, USDOT Modernization)
State/City Mobility Mandates & Data Sharing Requirements
- Strategic Frameworks
- Porters Five Forces (USA MaaS Context)
- Ecosystem Heatmap (Public, Private, Tech Partners)
- By Value, 2019 -2025
- By Volume, 2019 -2025
- By Average Price of Platforms/Services, 2019-2025
- By Service Type (In Value %)
Ride‑Hailing (Pay‑Per‑Ride)
Ride‑Sharing/Carpooling
Car‑Sharing
Micro‑Mobility (E‑Scooter/Bikes)
Shuttle/On‑Demand Transit
Autonomous Mobility Services
- By Platform Type (In Value %)
Integrated MaaS App (Multimode)
Single‑Service Provider
OEM Native Platform
Transit‑Integrated Platform
- By Access Model (In Value %)
Subscription‑First
Pay‑Per‑Use
Hybrid Bundles (Subscriptions + Micro‑Transactions)
- By User Type (In Value %)
B2C Commuters
Corporate Programs (Employee Mobility)
Government Agencies
Tourists / Visitors
- By Technology Stack (In Value %)
AI/ML Trip Orchestration
Real‑Time Data Analytics
Autonomous Fleet Integration
Blockchain/Tokenized Payments
- Market Share by Revenue & User Base (Platform & Service Value Pools)
- Cross‑Comparison Parameters (Competitive Positioning & Value Proposition, Business Model (Subscription vs Pay‑Per‑Use Emphasis), Technology Differentiators (AI routing, Real‑Time Optimization, AV Integration), Revenue & Growth Rates (ARR, GMV, Trip Yield), User Base & Retention Metrics, Platform Integrations & API Partnerships, Regulatory & Compliance Credentials, Strategic Alliances & Public Transit Integrations)
- Detailed Profiles of Key Industry Players
Uber Technologies, Inc.
Lyft, Inc.
Waymo (Alphabet)
Tesla Robotaxi Network
Via Transportation
Getaround / Turo
Zipcar (Avis)
Bird / Lime (Micro‑Mobility)
MaaS Global (Whim)
Transit (via Transit App)
Moovit (Intel)
Bridj (On‑Demand Shuttles)
Curb Mobility
Scoot Networks
Revel Transit
- User Demand Behavior (Trip Frequency, Loyalty, Churn)
- Price Sensitivity & Willingness to Pay Metrics
- Decision Drivers (Convenience, Cost, Speed, Sustainability)
- Pain Point Mapping & Opportunity Funnels
- Future Market Size by Value, 2026-2030
- Future Market Size by Volume, 2026-2030
- Average Frame Cost Outlook, 2026-2030
 Market Outlook to 2030")
 Market Outlook to 2030")
 Market Outlook to 2030")
 Market Outlook to 2030")
 Market Outlook to 2030") Request a Sample
Request a Sample Market Outlook to 2030") Ask for Customization
Ask for Customization Market Outlook to 2030") Get a Quote
Get a Quote Market Outlook to 2030") Enquire Now
Enquire Now Market Outlook to 2030")