 Platforms Market Outlook 2030")
 Platforms Market Outlook 2030") Download PDF
Download PDF Download PDF
Market Overview
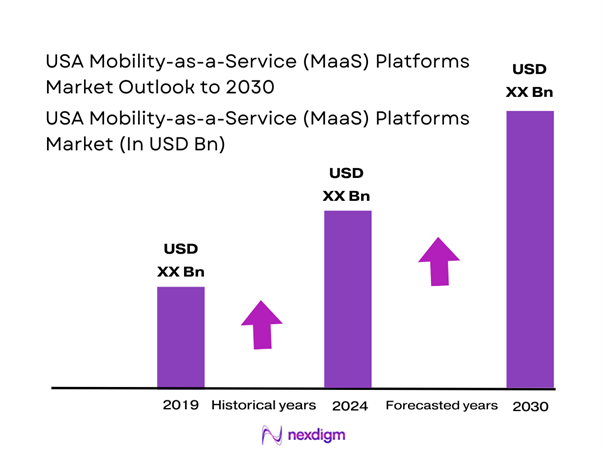
The USA Mobility-as-a-Service (MaaS) Platforms market is anchored by platform-mediated trip discovery, booking, and payment across multiple modes, with revenue primarily captured via ride-hailing/ride-sharing orchestration, ticketing/payment enablement, and platform fees in enterprise/public-sector deployments. In the latest year, the U.S. MaaS market generated USD ~ million in revenue (platform-enabled mobility services and MaaS solution layers), supported by continued digitization of urban mobility and “super-app” style bundling.
Market demand concentrates in large, multimodal metros where smartphone-first mobility is structurally advantaged: New York City, Los Angeles, San Francisco Bay Area, Chicago, Washington DC, Boston, and Seattle typically lead adoption due to dense public transit networks, high rideshare utilization, integrated fare initiatives, airport-ground transport complexity, and enterprise commuter programs. U.S. dominance within North America is reinforced by scale economics (multi-city platform operations) and strong private-sector participation across ride-hailing, micromobility, parking, and payment stacks.
Market Segmentation
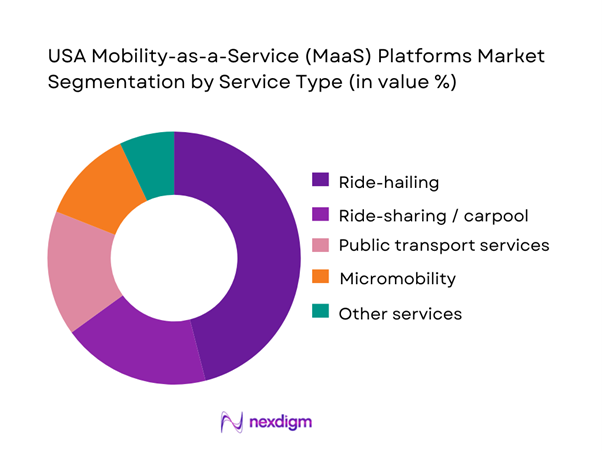
By Service Type
USA MaaS Platforms are segmented into ride-hailing, ride-sharing/carpool, public transport services, micromobility, and other services. Ride-hailing leads because it is the most consistently available “fallback mode” across U.S. metros—operating beyond fixed-route constraints, covering first/last-mile gaps, and handling time-sensitive trips (airport runs, late-night travel, low-frequency corridors). MaaS platforms also monetize ride-hailing efficiently through dispatch, dynamic pricing, and high-frequency repeat usage, making it the core revenue engine that cross-subsidizes multimodal discovery. In the U.S., ride-hailing additionally benefits from dense driver supply in top cities, strong app habit formation, and integrations with mapping, payments, and corporate expense workflows—making it the default mode users expect MaaS to surface first when optimizing time and reliability.
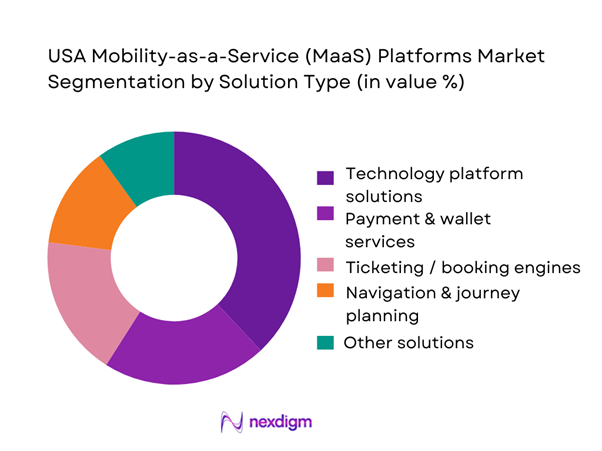
By Solution Type
USA MaaS Platforms are segmented into technology platform solutions, payment & wallet services, ticketing/booking engines, navigation & journey planning, and other solutions. Technology platform solutions dominate because U.S. MaaS is fundamentally an integration problem: stitching together multiple operators (rideshare, transit agencies, micromobility fleets, parking, tolling, airports, employers) requires robust orchestration, identity, pricing rules, APIs, and real-time data handling. The platform layer also becomes the “system of record” for multimodal availability, service quality monitoring, fraud controls, and partner settlement—so its value scales with each new city, agency, or operator added. For enterprise and public-sector deployments, the platform layer additionally carries procurement-friendly features (audit trails, SLA monitoring, compliance controls), making it the anchor spend item versus single-function modules like routing or a standalone wallet.
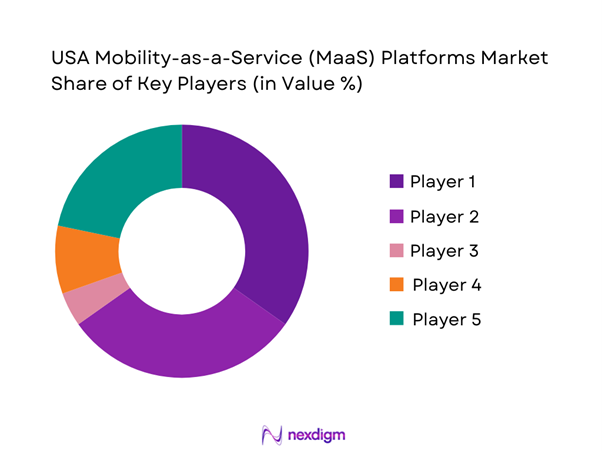
Competitive Landscape
The USA MaaS Platforms market is shaped by a mix of global ride-hailing networks that already own demand and payments, public-transit technology vendors that power fare collection, real-time data, and agency integrations, and mobility integrators (on-demand transit, corporate MaaS, parking, and multimodal aggregators) building end-to-end orchestration. The competitive outcome typically depends on who controls user demand (consumer apps), who controls the rails (ticketing/payment + agency contracts), and who can scale multimodal partnerships city-by-city.
| Company | Est. year | HQ | Core MaaS proposition | Multimodal coverage depth | Payments / wallet depth | Transit/agency integration strength | Enterprise MaaS (employer/campus) | Data/interop readiness (GTFS, APIs) |
| Uber | 2009 | San Francisco, USA | ~ | ~ | ~ | ~ | ~ | ~ |
| Lyft | 2012 | San Francisco, USA | ~ | ~ | ~ | ~ | ~ | ~ |
| Via | 2012 | New York, USA | ~ | ~ | ~ | ~ | ~ | ~ |
| Cubic Transportation Systems | 1987 | San Diego, USA | ~ | ~ | ~ | ~ | ~ | ~ |
| Moovit (Intel) | 2012 | Israel / USA ops | ~ | ~ | ~ | ~ | ~ | ~ |
USA Mobility-as-a-Service Platforms Market Analysis
Growth Drivers
FTA complete-trip initiatives
FTA “complete trip” programs are directly seeding MaaS platform functionality—trip planning, eligibility-aware booking, and integrated payments—through competitively awarded pilots that require agencies to connect riders across modes and operators. This demand is amplified because the U.S. has a large, urban, high-frequency travel base where trip-chaining (first/last mile + trunk transit) is commercially meaningful: the U.S. population is ~ and GDP is USD ~, which supports dense metro labor markets and recurring commuter/errand travel that MaaS platforms can aggregate. On the funding side, IIJA authorizes USD ~ in “Transit Formula Grants Total” for a single year of the authorization table—a scale that pushes agencies to modernize rider-facing digital layers to meet grant expectations (equity, access, data reporting, and customer experience).
Open-loop payment adoption
Open-loop (bankcard/mobile wallet) acceptance is a major MaaS accelerant because it removes the “closed-loop card” barrier that prevents cross-agency mobility accounts from scaling. The clearest proof point is New York’s OMNY: the MTA reported ~ “taps” on OMNY (subway + bus) as a milestone announcement, showing mass-market comfort with tap-based access and the transaction volumes needed for account-based, rules-driven fare products to work reliably at city scale. That matters for MaaS because open-loop creates a universal identity proxy (a tokenized PAN / device credential) that can be recognized across services—transit, microtransit, and partner mobility—without issuing a new credential for every operator. Macro conditions support this adoption: the World Bank reports U.S. GDP per capita at USD ~, which is consistent with high card-and-wallet penetration and a retail ecosystem already accustomed to contactless checkout experiences MaaS can mirror.
Challenges
Multi-agency governance complexity
MaaS platforms face governance friction because U.S. mobility is typically delivered by a mosaic of city, county, regional, and state agencies—each with its own board priorities, policies, and data controls. USDOT’s ITS Deployment Tracking Survey provides a useful proxy for this complexity: it identified ~ eligible transit agencies for its transit management sample and received ~ completed surveys, illustrating the breadth of distinct “decision centers” that a MaaS program may need to align even before adding DOTs, toll authorities, airports, and private operators. Governance complexity is amplified by scale: the U.S. population is ~ spread across many metropolitan regions, with large multi-jurisdiction commutes that naturally cross agency boundaries. In practical terms, MaaS “complete trip” experiences require agreements on roles (who owns the account, who sets fare policy, who resolves disputes, who funds discounts, who carries ADA compliance risk), which tend to be negotiated at multi-agency tables and can stall deployments.
Fragmented fare policies
Fare policy fragmentation is a core MaaS blocker because even if trip planning is unified, riders abandon “one app” journeys when they hit different fare media, transfer rules, eligibility categories, and discount structures across providers. USDOT’s survey shows that among agencies providing open data feeds (~ agencies), the feed content is still uneven—many provide static and real-time service data, but the survey explicitly tracks whether agencies publish fare price/payment information as an element (meaning many feeds remain incomplete for end-to-end “shop and pay” MaaS flows). Where fare content exists, harmonizing policy is still hard because agencies have legitimate reasons to differ: local funding structures, equity fare programs, and legacy pass products. The resulting fragmentation is expensive to unify because it requires account-based back-office logic and inter-agency settlement. Macro conditions intensify the real-world impact of fragmentation: with GDP at USD ~ and urban population share at ~, U.S. metro travelers generate extremely high volumes of multimodal trips where “transfer friction” shows up as abandonment, reduced ridership conversion, and higher customer support load—costs that are operationally visible even if they are not recorded as a line-item “market statistic.”
Opportunities
Account-based regional interoperability
Account-based ticketing (ABT) and regional interoperability are a high-upside MaaS opportunity because they enable “one customer account” across multiple agencies and modes with centralized rules (fare capping, concessions, employer benefits, eligibility discounts) and automated inter-agency settlement. The strongest evidence that ABT-like behavior can scale is OMNY’s transaction volume: ~ taps indicates riders will adopt a tap-and-go paradigm at metro scale, which ABT systems can extend across partner mobility services once governance and settlement are solved. The opportunity is also supported by public funding capacity for modernization: IIJA’s authorization table shows USD ~ for transit formula grants in one year, a financing base agencies use to replace validators, back offices, and data systems that ABT requires. Data maturity is moving in the right direction: ~ agencies provide open data feeds, which gives MaaS platforms a larger starting set for standardized discovery and real-time routing integrations as they build toward transactional interoperability.
Employer and university mobility wallets
Mobility wallets funded by employers and universities are an attractive MaaS growth lever because they can “bundle” multiple modes under a governed entitlement (who can spend, on what modes, in what geography, at what time) and drive repeat use without requiring riders to navigate fare complexity. The IRS commuter benefit monthly limit of USD ~ (as specified in annual inflation-adjustment guidance) creates a standardized ceiling for employer-sponsored wallet structures, and MaaS platforms can operationalize this via stored value, fare products, and cross-mode credits while keeping compliance straightforward for payroll and finance teams. On the ecosystem readiness side, USDOT’s transit survey shows ~ agencies already operate agency-branded trip planners, which are natural integration points for employer/university single sign-on, subsidized products, and curated multimodal options. The mode mix that wallets can activate is already operating at meaningful volumes: Citi Bike logged ~ trips in one month, which is the type of high-frequency micro-mobility usage pattern that commuter wallets can convert into default first/last mile behavior around transit.
Future Outlook
Over the next cycle, USA MaaS Platforms are expected to expand from “multi-mode discovery” into transactional MaaS (book + pay + validate) as agencies modernize fare systems, open payments matures, and corporate mobility budgets shift toward integrated commuter benefits. Platform differentiation will increasingly come from interoperability at scale (faster partner onboarding), reliability and safety analytics, and unit-economics optimization (fraud controls, incentives, and supply balancing). Directionally, published MaaS growth expectations vary by definition and scope; global benchmarks indicate strong growth.
Major Players
- Uber
- Lyft
- Via
- Moovit
- Cubic Transportation Systems
- Transit
- Beep, Inc.
- Ridecell
- Metropolis Technologies
- Transdev
- Siemens Mobility
- SkedGo
- Trafi
- Bird
Key Target Audience
- Investments and venture capitalist firms
- Government and regulatory bodies
- State Departments of Transportation
- Metropolitan Planning Organizations
- Public transit agencies and authorities
- Airport authorities and airport ground transportation operators
- Large employers & commuter benefits program owners
- Mobility operators and fleet owners
Research Methodology
Step 1: Identification of Key Variables
We first build a USA MaaS ecosystem map across demand aggregators, transit agencies, micromobility operators, payment/ticketing vendors, and platform enablers. Desk research is used to define variables such as multimodal coverage, payment rails, integration depth, and platform monetization levers that determine revenue capture and scalability.
Step 2: Market Analysis and Construction
We compile historical indicators (platform deployments, operator integrations, and service-type composition) and align them with published market sizing for the USA MaaS domain. We then structure revenue mapping by component/service and validate how value is captured across ride-hailing orchestration, public transport enablement, and platform-layer licensing.
Step 3: Hypothesis Validation and Expert Consultation
Hypotheses on adoption drivers (agency fare modernization, employer mobility budgets, multimodal subscription models) are validated through structured expert interviews (CATIs) with platform vendors, transit agency stakeholders, and mobility operators to confirm procurement patterns, integration timelines, and operational constraints.
Step 4: Research Synthesis and Final Output
We triangulate bottom-up inputs (deployments, integrations, operator partnerships) with top-down published benchmarks to finalize segmentation logic, competitive positioning, and opportunity sizing themes—ensuring the conclusions are consistent across stakeholder reality, platform economics, and reported market statistics.
- Executive Summary
- Research Methodology (Market definitions and taxonomy, Inclusion and exclusion criteria, Platform capability scoring model, Primary interview framework, Secondary source triangulation, Deployment case screening logic, Data validation and limitations, Terminology and abbreviations)
- Digitally Mature Urban Mobility Ecosystem
- Multimodal Complexity as a Core Demand Driver
- Strong Role of Private-Sector Platforms
- Public Transit Modernization and Open Payments
- Enterprise and Institutional MaaS Adoption

- Growth Drivers
FTA complete-trip initiatives
Open-loop payment adoption
Employer-sponsored mobility benefits
Micromobility and microtransit integration
Regional fare modernization programs - Challenges
Multi-agency governance complexity
Fragmented fare policies
Data-sharing and interoperability friction
Lengthy public-sector procurement cycles
Legacy system integration constraints - Opportunities
Account-based regional interoperability
Employer and university mobility wallets
Paratransit and on-demand transit modernization
AI-driven disruption and demand management
Outcome-linked MaaS contracts - Trends
Fare capping and best-fare logic
Super-app convergence
Microtransit embedded within MaaS
Real-time multimodal disruption management
Mobility marketplaces - Regulatory & Policy Landscape
- SWOT Analysis
- Stakeholder & Ecosystem Analysis
- Porter’s Five Forces Analysis
- Competitive Intensity & Ecosystem Mapping
- By Revenue, 2019–2024
- By Platform Type, 2019–2024
- By Buyer Type, 2019–2024
- By Deployment Model, 2019–2024
- By Region, 2019–2024
- By Fleet Type (in Value %)
Journey-planning-led platforms
Fare-led and ticketing-centric platforms
Agency-suite-led MaaS platforms
Marketplace-led MaaS aggregators
Employer-led mobility platforms - By Application (in Value %)
Urban commuting
First-mile and last-mile connectivity
Airport and campus mobility
Paratransit and accessibility services
Tourism and visitor mobility - By Technology Architecture (in Value %)
Cloud-native SaaS platforms
Modular microservices-based platforms
Legacy AFC-integrated architectures
API-first open MaaS stacks
Proprietary closed-loop platforms - By Connectivity Type (in Value %)
Mobile application-based MaaS
Web-based MaaS portals
Account-based ticketing platforms
Open-loop EMV-enabled platforms
Offline-capable hybrid platforms - By End-Use Industry (in Value %)
Public transit agencies
City and state transportation departments
Metropolitan planning organizations
Employers and universities
Airports, campuses, and real-estate districts - By Region (in Value %)
Northeast
Midwest
South
West
- Cross Comparison Parameters (Multimodal inventory breadth, Plan-book-pay maturity, Account-based ticketing readiness, Multi-agency interoperability support, Standards and API coverage, Integration complexity with legacy systems, Security and compliance posture, Analytics and reporting depth)
- Detailed Profiles of Major Companies
Uber
Lyft
Via Transportation
Moovit
Transit App
Cubic Transportation Systems
Masabi
Conduent Transportation
INIT
Trapeze Group
RideCo
SkedGo
Citymapper
Google
- Transit agency buyer journey
- Regional authority/MPO decision model
- Employer & university procurement
- Airport/campus/district use-cases
- Passenger segmentation
- By Revenue, 2025–2030
- By Platform Type, 2025–2030
- By Buyer Type, 2025–2030
- By Deployment Model, 2025–2030
- By Region, 2025–2030
 Platforms Market Outlook 2030")
 Platforms Market Outlook 2030")
 Platforms Market Outlook 2030")
 Platforms Market Outlook 2030")
 Platforms Market Outlook 2030") Request a Sample
Request a Sample Platforms Market Outlook 2030") Ask for Customization
Ask for Customization Platforms Market Outlook 2030") Get a Quote
Get a Quote Platforms Market Outlook 2030") Enquire Now
Enquire Now Platforms Market Outlook 2030")