
 Download PDF
 Download PDF
Market Overview
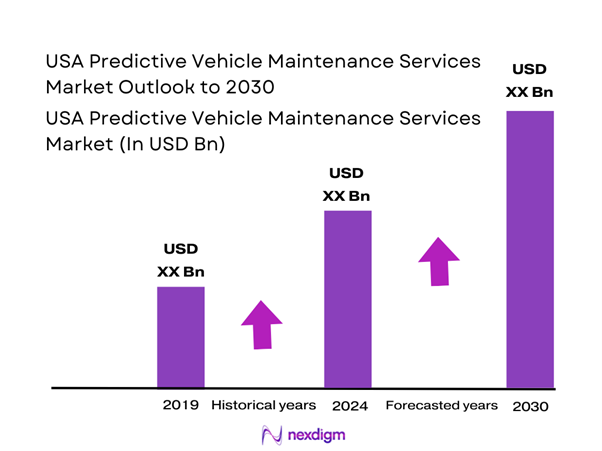
The USA Predictive Vehicle Maintenance Services Market generated USD ~ billion in revenue in the latest year, up from USD ~ billion in the prior year, reflecting accelerated adoption of telematics-led diagnostics, AI-driven fault prediction, and remote monitoring as fleets prioritize uptime. A critical structural driver is the aging vehicle parc—average vehicle age is ~ years, up by ~ versus the prior year—expanding the addressable base for proactive maintenance interventions across passenger and commercial vehicles.
Dominance concentrates around freight and fleet-command hubs (large logistics corridors, port/rail nodes, and metro regions with dense last-mile delivery footprints) because these ecosystems have the highest operational penalty for unplanned downtime and the strongest installed base of connected-fleet platforms. Macro signals reinforce this concentration: trucks moved ~ tons of freight (vs ~ tons in the prior year), keeping fleet utilization high even in softer cycles, while carrier fragmentation sustains demand for “maintenance intelligence-as-a-service” that SMEs can consume without building internal data science teams.
Market Segmentation
By Vehicle Type
The USA Predictive Vehicle Maintenance Services Market is segmented by vehicle type into passenger vehicles and commercial vehicles. In practice, passenger vehicles dominate because predictive features are increasingly embedded at the OEM platform level—factory-installed sensors, onboard diagnostics streams, and connected-vehicle services create a “default-on” data pipeline that scales across millions of vehicles. This pushes predictive maintenance from a fleet-only tool into a mass-market capability (alerts, proactive service scheduling, component health scoring). The passenger side also benefits from the rising average age of vehicles, increasing the value of early fault detection to avoid breakdowns and manage ownership costs. Meanwhile, commercial vehicles show faster expansion dynamics because fleets directly monetize uptime; however, the absolute installed base effect keeps passenger vehicles as the leading segment.

By End Use
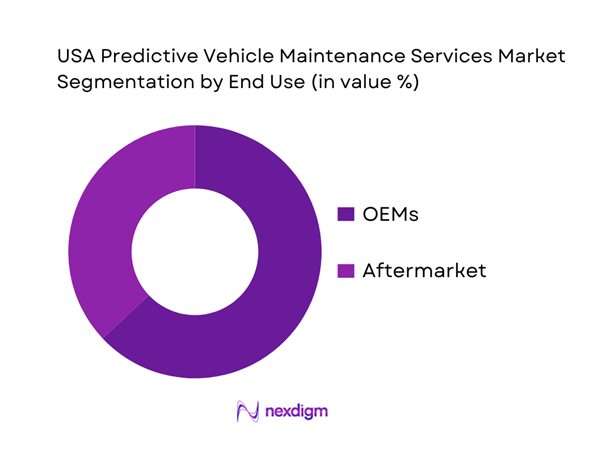
The market is segmented by end use into OEMs and Aftermarket. OEM-led delivery dominates because automakers can integrate predictive maintenance natively into the vehicle architecture—sensors, ECUs, telematics control units, and cloud connectivity are designed as a single system, producing cleaner data, fewer integration failures, and higher prediction accuracy than bolt-on retrofits. OEMs also use predictive maintenance to reduce warranty leakage, improve service retention, and expand connected services revenue. The aftermarket remains essential for retrofitting legacy fleets, mixed-brand operations, and specialized assets (regional haul, vocational trucks, municipal vehicles), but it faces friction from heterogeneous hardware, variable data quality, and integration debt across TMS/ERP/CMMS stacks. As a result, OEMs maintain the lead while aftermarket grows on the back of device marketplaces and partner ecosystems.
Competitive Landscape
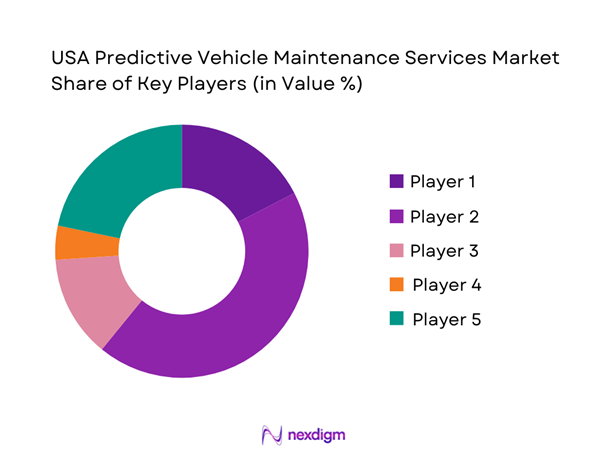
The USA Predictive Vehicle Maintenance Services Market is influenced by a set of telematics and fleet-platform leaders, alongside industrial/enterprise software providers that enable analytics, integration, and large-fleet operationalization. Competitive advantage is shaped by depth of vehicle-data ingestion (fault codes, mileage, sensor streams), maintenance workflow tooling, ecosystem partnerships (tires, parts, OEMs), and enterprise integration readiness for multi-site fleets.
| Company | Est. year | HQ | Core predictive maintenance capability | Primary data layer | Maintenance workflow strength | Integration ecosystem | Typical buyer fit | Differentiation lever |
| Samsara | 2015 | USA | ~ | ~ | ~ | ~ | ~ | ~ |
| Geotab | 2000 | Canada | ~ | ~ | ~ | ~ | ~ | ~ |
| Verizon Connect | 2001 | USA | ~ | ~ | ~ | ~ | ~ | ~ |
| Trimble | 1978 | USA | ~ | ~ | ~ | ~ | ~ | ~ |
| IBM | 1911 | USA | ~ | ~ | ~ | ~ | ~ | ~ |
USA Predictive Vehicle Maintenance Services Market Landscape Analysis
Growth Driver
ELD and telematics penetration creating maintenance data exhaust
The USA’s ELD mandate effectively digitized hours-of-service recordkeeping for most regulated carriers, turning compliant operations into continuous “data exhaust” (engine hours, duty cycles, location breadcrumbs) that can be fused with vehicle health signals for predictive maintenance triggers. FMCSA sets the compliance date at ~ for required carriers (with grandfathered AOBRD transition referenced in FMCSA materials), which accelerated standardized electronic logs across interstate trucking. This data scale matters because the US operating base is huge: FHWA’s Highway Statistics show ~ trucks registered and ~ total motor vehicles registered in a recent national registration table, underscoring the addressable population where log + telematics streams can be converted into maintenance actions. Macro conditions support ongoing fleet digitization: the IMF DataMapper reports US GDP (current prices) of USD ~ trillion and average consumer price inflation of ~ (annual percent change) in the same macro snapshot—an environment where uptime, fuel/maintenance efficiency, and compliance automation become board-level priorities rather than optional projects.
Rising vehicle utilization in last-mile and on-demand delivery
Last-mile intensity raises maintenance frequency (brakes/tires/suspension), increases unscheduled downtime risk, and makes predictive maintenance economically “visible” because service failures immediately hit delivery SLAs and customer churn. A hard indicator of last-mile volume is retail e-commerce throughput: the US Census Bureau reported USD ~ billion in retail e-commerce sales (not adjusted basis) for one quarter, and also reported USD ~ billion (seasonally adjusted) for the same quarter—two official series that demonstrate the scale of parcel-driven demand flowing into vans, box trucks, and mixed fleets. Freight intensity is also evident in federal transportation statistics: BTS reports the US system moved a daily average of ~ tons of freight valued at USD ~ billion (daily average) in a recent national freight snapshot—volumes that amplify utilization for linehaul + final-mile handoffs and increase the payoff of predicting failures before they cascade into missed delivery windows. Macro context again reinforces why fleets pay for “uptime math”: IMF DataMapper lists US GDP of USD ~ trillion and inflation of ~, which typically drives stricter cost governance and ROI-backed maintenance automation across transportation spend.
Challenge
Data heterogeneity across vehicle makes and models
Predictive maintenance in the US is structurally harder than “single-OEM” markets because fleets run mixed assets: different ECM schemas, sensor availability, diagnostic trouble code taxonomies, and varying inspection regimes across truck, van, and specialized equipment. The scale and diversity is visible in registration statistics: FHWA Highway Statistics shows ~ trucks registered in one table year and ~ trucks in the prior table year—huge populations that are not technologically uniform. The heterogeneity compounds when fleets include vocational bodies (refrigeration units, liftgates), aftermarket devices, and multiple telematics vendors—each generating different field names, sampling rates, and event definitions that must be normalized before models can be trusted. Operationally, the “one model per OEM/per engine family” reality increases ML lifecycle cost and can slow rollout, especially for national fleets operating across states with different inspection practices. Against that complexity, macro scale still pushes investment: IMF DataMapper lists US GDP of USD ~ trillion and ~ inflation—conditions where large fleets rationalize platforms, but smaller operators can struggle to fund integration and data governance needed to overcome heterogeneity.
False positives and alert fatigue
False positives undermine adoption because they create “noise labor”: technicians chase non-issues, drivers ignore alerts, and dispatch loses confidence in recommendations—especially when fleets operate at high tempo. The risk is magnified by the size of the workforce and daily freight activity. BLS reports ~ heavy and tractor-trailer truck driver jobs—meaning even a small per-driver alert load can explode into millions of operational interruptions if models aren’t calibrated to fleet-specific duty cycles. BTS reports the system moves ~ tons of freight per day, so unnecessary pull-ins have real service consequences (missed windows, cascading delays). In practice, fleets respond by raising thresholds and suppressing alerts, which can delay genuine failures and reduce the headline value of predictive maintenance. Overcoming alert fatigue requires tighter labeling loops (wrench-turn outcomes), triage logic that bundles alerts into serviceable work orders, and clear “confidence + consequence” scoring for shop foremen. Macro signal: IMF DataMapper shows US GDP at USD ~ trillion and inflation ~, reinforcing that productivity (fewer wasted bay hours) and operational reliability are the dominant justifications for improving model precision rather than simply generating more alerts.
Opportunity
Outcomes-based uptime and availability contracts
A high-leverage growth path is shifting from “software subscription” to outcomes-based agreements where vendors get paid for verified uptime, reduced road calls, or higher asset availability—structures that procurement teams increasingly prefer because they align spend to operational results. The US operating environment supports this: BTS reports ~ tons of freight moved per day valued at USD ~ billion, and the Census Bureau reports quarterly e-commerce volumes like USD ~ billion (seasonally adjusted) and USD ~ billion (not adjusted) in a single quarter—numbers that reflect how costly downtime is in a high-velocity delivery economy. Safety data also supports the “outcomes” argument: NHTSA estimates ~ total traffic fatalities in one year and reports large-truck-involved deaths such as ~ in a later year, keeping insurers and enterprise shippers focused on measurable risk reduction. Vendors that can instrument outcomes (work-order completion quality, repeat failure suppression, parts availability synchronization) are better positioned to win enterprise contracts than vendors that only provide alerts.
AI-assisted technician triage and diagnostics
AI-assisted triage is a practical growth lever because it converts raw fault codes and noisy sensor anomalies into technician-ready actions: “what to check first,” “parts likely needed,” and “is it safe to defer.” This directly addresses alert fatigue and bay congestion while improving first-time fix rates—especially important given workforce scale. BLS lists ~ heavy and tractor-trailer truck driver jobs (which correlates with sustained maintenance throughput needs), while national safety data keeps pressure on diagnostic quality: FMCSA reports ~ large trucks and buses involved in fatal crashes in a referenced year, and NHTSA’s large-truck fact sheet reports ~ large-truck occupants injured in one year alongside ~ occupants of other vehicles injured in crashes involving large trucks—figures that reinforce the need for quicker, more reliable defect detection and repair decisions. In practice, triage AI becomes most valuable when integrated into CMMS workflows: it can prioritize work orders by risk and operational impact, recommend inspection checklists, and reduce unnecessary parts swaps.
Future Outlook
Over the next five years, the USA Predictive Vehicle Maintenance Services Market is expected to expand as fleets move from “alerting” to prescriptive maintenance orchestration—automated work orders, parts pre-positioning, and technician scheduling triggered by predicted remaining useful life. OEM-native predictive services should deepen with software-defined vehicles, while the aftermarket scales through device marketplaces and packaged integrations for SMB fleets. The macro environment continues to favor uptime economics: aging vehicles and high freight intensity keep maintenance avoidance costs material, pushing adoption across trucking, last-mile delivery, utilities, public fleets, and rental/leasing operators.
Major Players
- Samsara
- Geotab
- Verizon Connect
- Trimble
- IBM
- Bosch
- Continental
- Siemens
- Microsoft
- PTC
- GE (GE Digital)
- Oracle
- Noregon
- ZF
Key Target Audience
- Fleet operators and fleet-management groups
- Automotive OEM connected services and aftersales divisions
- Tier-1 suppliers and component OEMs
- Telematics service providers and fleet-platform product teams
- Insurance and risk underwriting teams
- Automotive retail dealer groups and service networks
- Investments and venture capitalist firms
- Government and regulatory bodies
Research Methodology
Step 1: Identification of Key Variables
We begin by mapping the U.S. connected-maintenance ecosystem across OEMs, telematics platforms, fleet operators, and data partners. Secondary research is used to define the measurable variables: vehicle connectivity penetration proxies, maintenance workflow maturity, and adoption constraints by fleet class.
Step 2: Market Analysis and Construction
We compile the published revenue baseline for the U.S. market and structure the service value chain into data capture, analytics, and maintenance execution. Segment logic is built around vehicle type and end-use delivery models, consistent with how suppliers package and monetize offerings.
Step 3: Hypothesis Validation and Expert Consultation
We validate operating assumptions through expert interviews with fleet maintenance leaders, platform providers, and channel partners. These discussions focus on fault-code enrichment, alert-to-action conversion, integration bottlenecks, and KPI definitions (downtime, MTBF/MTTR, compliance readiness).
Step 4: Research Synthesis and Final Output
We triangulate insights into a final strategic model covering competitive positioning, segment priorities, buyer journeys, and go-to-market options. Outputs are checked for internal consistency against the published market baseline and the segment structure used by leading market datasets.
- Executive Summary
- Research Methodology (Market definition taxonomy, inclusion/exclusion of fleet management vs predictive maintenance, triangulation approach, interview map across fleet maintenance directors CIO IT safety compliance OEM dealer service 3PL, duty cycle and PM assumptions, data validation using DTC normalization and service record reconciliation, limitations including EV data sparsity)
- Definition and Scope
- Market Genesis and Evolution
- Timeline of Major Platform and OEM Developments
- Industry Business Cycle Dynamics
- Data, Technology, and Service Value Chain Analysis

- Growth Drivers
ELD and telematics penetration creating maintenance data exhaust
Rising vehicle utilization in last-mile and on-demand delivery
Commercial EV pilots generating new battery and thermal telemetry
Insurance and safety program linkage with predictive maintenance - Challenges
Data heterogeneity across vehicle makes and models
False positives and alert fatigue
Integration debt with TMS ERP and CMMS
Labor resistance and driver privacy concerns
Limited coverage for trailers and non-powered assets - Opportunities
Outcomes-based uptime and availability contracts
AI-assisted technician triage and diagnostics
Predictive parts stocking and supply chain optimization
OEM embedded data monetization
Advanced battery health analytics for EV fleets - Trends
OEM API-first vehicle health data access
Expansion of telematics and analytics marketplaces
GenAI-powered maintenance copilots
Edge analytics for latency-critical alerts
Heightened cybersecurity and data governance expectations - Regulatory & Policy Landscape
- SWOT Analysis
- Stakeholder & Ecosystem Analysis
- Porter’s Five Forces Analysis
- Competitive Intensity & Ecosystem Mapping
- By Value, 2019–2024
- Installed Base by Connected Vehicles, 2019–2024
- Service Revenue Mix, 2019–2024
- By Fleet Type (in Value %)
Class 1–2 fleets
Class 3–6 fleets
Class 7–8 tractor fleets
Vocational fleets
Mixed fleets - By Application (in Value %)
Condition monitoring
Prognostics and remaining useful life modeling
Remote diagnostics and triage
Maintenance workflow automation
Parts forecasting and inventory planning - By Technology Architecture (in Value %)
OBD-II dongle based systems
Hardwired CAN and J1939 systems
OEM embedded modem and API-based systems
ELD-engine synchronized platforms
Sensor add-ons including vibration temperature oil quality - By Connectivity Type (in Value %)
Standalone SaaS deployments
Telematics platform bundled deployments
CMMS-integrated deployments
OEM or dealer-led service deployments
Managed service and outsourced analytics models - By End-Use Industry (in Value %)
For-hire trucking
Last-mile and parcel delivery
Field service and utilities
Construction and equipment rental
Municipal and public sector fleets - By Region (in Value %)
Northeast
Midwest
South
West
- Competitive Positioning Map
- Cross Comparison Parameters (predictive signal depth across systems, OEM embedded data access and API coverage, modeling approach rules versus ML versus RUL, maintenance workflow tooling depth, integration readiness with TMS ERP CMMS, installer and after-sales footprint, compliance and cybersecurity posture, asset class coverage)
- Company SWOT Snapshots
- Commercial Model Benchmarking
- Detailed Profiles of Major Companies
Samsara
Geotab
Verizon Connect
Motive
Uptake
Trimble Transportation
Solera Fleet Solutions
Lytx
Netradyne
Zonar Systems
Powerfleet
Teletrac Navman
Fleet Complete
Ford Pro
- End User Demand Patterns and Utilization Behavior
- Procurement and Budget Ownership Structure
- Decision-Making and Vendor Selection Criteria
- Adoption Barriers and Change Management Challenges
- Use-Case Prioritization by Fleet Segment
- By Value, 2025–2030
- Installed Base by Connected Vehicles, 2025–2030
- Service Revenue Mix, 2025–2030


 Request a Sample
 Ask for Customization
 Get a Quote
 Enquire Now