
 Download PDF
 Download PDF
Market Overview
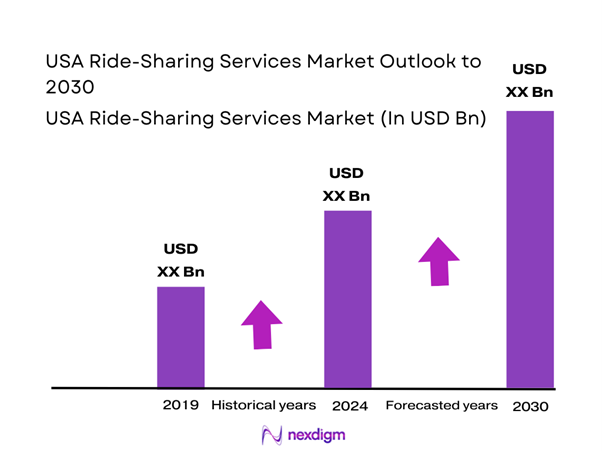
The USA ride-sharing services market is valued at USD ~ billion, supported by a five-year historical analysis of industry revenues and the recovery of airport, events, and discretionary travel mobility. Demand strength is visible in platform throughput: Mobility Gross Bookings of USD ~ billion were reported in the 2024 fourth quarter, compared with USD ~ billion in the prior-year fourth quarter, reflecting higher trip volumes and sustained rider usage. Key drivers include dense metro trip frequency, airport corridor utilization, dynamic pricing efficiency, and improving matching/ETA performance that preserves rider conversion even during peak periods.
The market is concentrated in large, high-density metros and airport-led corridors where network effects are strongest and multimodal alternatives are most constrained during peak hours. Major demand anchors include New York City, Los Angeles, Chicago, the Bay Area, and other high-traffic urban clusters, driven by high tourist volume, event calendars, late-night mobility demand, and airport trip intensity. These metros also exhibit stronger supply liquidity (more active drivers and faster pickup times), which reinforces platform reliability and encourages repeat usage. Business travel and airport regulation frameworks (staging lots, pickup rules, and fee structures) further shape where ride-sharing scales efficiently, supporting persistent dominance of airport-centric markets.
Market Segmentation
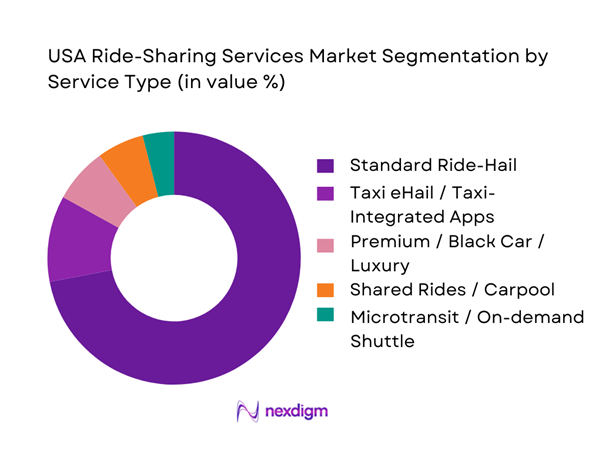
By Service Type
The USA ride-sharing services market is segmented by service type into standard ride-hail, taxi eHail/taxi-integrated apps, premium/black car, shared rides/carpool, microtransit/on-demand shuttle, and accessible/assisted rides. Standard ride-hail has the dominant market share because it is the default “instant mobility” product with the highest supply liquidity and the broadest geographic coverage, which directly improves pickup ETAs and reduces rider drop-offs in the booking funnel. This segment also benefits most from dynamic pricing and upfront fare presentation, enabling platforms to balance demand spikes (airports, nightlife, events) and maintain trip fulfillment. The unit economics are structurally stronger because standard ride-hail supports high trip density and better driver utilization versus niche modalities. In addition, platform investments in safety tooling, customer support workflows, and payment reliability disproportionately strengthen the core ride-hail proposition, reinforcing repeat usage and subscription attachment.
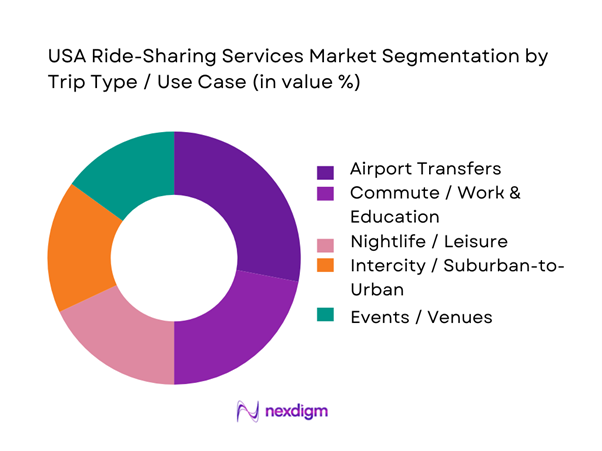
By Trip Type / Use Case
The USA ride-sharing services market is segmented by trip type into airport transfers, commute/work & education, nightlife/leisure, intercity/suburban-to-urban, events/venues, and first/last mile to transit. Airport transfers dominate because airports create predictable, high-frequency demand with higher average fares due to distance, tolls, and time-based components, while also sustaining two-way flows (drop-off + pickup) that support driver utilization. Airports operationally “standardize” ride-sharing through designated pickup zones, staging lots, and clear wayfinding, which increases conversion versus street-hail substitutes. Platforms also prioritize airport reliability with queue management and compliance features because airports regulate ridesharing access and fees, making operational excellence a competitive differentiator.

Competitive Landscape
The USA ride-sharing services market is dominated by a small set of scaled platforms (notably Uber and Lyft in core ride-hail), while taxi eHail aggregators and on-demand transit specialists compete in specific city or institutional corridors. This consolidation reflects the strength of network effects (driver supply + rider demand density), the importance of airport and city operating permissions, and the capital intensity of safety, insurance, support, and (increasingly) autonomous vehicle partnerships.
| Company | Est. Year | HQ | Core Service Focus | Coverage Model | Supply Model | Differentiation Lever | AV / EV Direction | Airport / Transit Partnerships |
| Uber | 2009 | San Francisco, USA | ~ | ~ | ~ | ~ | ~ | ~ |
| Lyft | 2012 | San Francisco, USA | ~ | ~ | ~ | ~ | ~ | ~ |
| Waymo (Waymo One) | 2009 | Mountain View, USA | ~ | ~ | ~ | ~ | ~ | ~ |
| Via Transportation | 2012 | New York, USA | ~ | ~ | ~ | ~ | ~ | ~ |
| Curb Mobility | 2007 | New York, USA | ~ | ~ | ~ | ~ | ~ | ~ |
USA Ride-Sharing Services Market Analysis
Growth Drivers
Urban congestion substitution
With the U.S. population at ~ and unemployment at ~, the addressable base for app-based urban mobility remains structurally large, especially in dense metro corridors where ridesharing substitutes (or complements) driving, parking, and fragmented transit links. Road-use intensity reinforces this substitution: nationwide traffic monitoring shows a cumulative ~ billion vehicle-miles traveled across the year, underscoring persistent congestion and peak-hour friction that supports on-demand trip replacement for short urban hops, first/last mile, and event-driven surges. At the same time, inflation measured at ~ keeps household budgeting sensitive to total trip utility—nudging consumers toward pay-per-trip convenience in dense zones rather than fixed ownership behaviors for every trip purpose. This macro backdrop matters because ridesharing demand is highly “time-value” oriented: higher road volumes raise the opportunity cost of delays, while large employed populations sustain recurring commute, errands, and nightlife movement in high-frequency city pairs that rideshare platforms optimize through matching, pooling, and dynamic routing.
Airport and venue demand concentration
Air travel volumes are a direct demand amplifier for ridesharing because airports and major venues create predictable “burst” peaks and high willingness-to-pay for reliability. Systemwide scheduled service passengers reached ~ million in a single month, including ~ million domestic and ~ million international passengers, an intensity that concentrates ride demand into airport geofences, hotel districts, and downtown transfers. This concentration interacts with the broader macro base—~ people and ~ unemployment—supporting frequent traveler flows and workforce-linked airport trips that generate recurring rideshare demand beyond leisure spikes. In addition, inflation at ~ keeps travelers value-aware; ridesharing benefits when travelers compare the all-in cost and time burden of parking, rental counters, and terminal shuttles against direct app pickup and drop-off. Because airports and venues are operationally constrained, demand tends to stack into short windows, and platforms that manage dispatch, pickup experience, and driver staging most efficiently capture outsize trip volumes from these nodes.
Challenges
Driver acquisition and retention
A tighter labor market makes driver acquisition more competitive, and retention becomes harder when alternative flexible work expands. The U.S. unemployment rate is ~, indicating limited slack; platforms must continuously recruit and re-activate drivers to maintain coverage in peak periods. Employment in transportation and warehousing stands at ~ million, demonstrating both the scale of adjacent labor and the competition for workers across logistics, delivery, and transport roles. Inflation at ~ raises the sensitivity to real take-home outcomes; even if headline inflation has eased from earlier levels, households still react to cumulative price-level effects—intensifying driver multi-homing and selective driving only during high-demand windows. This creates operational risk for rideshare: fewer always-on drivers means longer ETAs, higher cancellations, and lower service reliability, particularly in suburban markets and off-peak hours where trip density is weaker. Retention is also shaped by safety, deactivation policies, dispute resolution, and the ability to predict demand.
Regulatory enforcement variability
U.S. ridesharing compliance is fragmented across states, cities, and airports, producing uneven enforcement and permitting burdens that directly affect supply availability and pickup efficiency. State-level autonomous vehicle frameworks illustrate how mobility regulation can be operationally prescriptive; driverless deployment authorization is limited to ~ manufacturers under specific programs, highlighting how permissions are tightly controlled and location-dependent even within one state. In ridesharing, similar variability appears in airport rules, local fees, driver background check standards, and accessibility requirements, which can change dispatch economics and driver willingness to serve certain zones. Macro conditions amplify sensitivity: with ~ residents and ~ unemployment, any localized regulatory tightening can quickly translate into service gaps and public pressure because large populations rely on these services for late-night travel, airport connections, and areas with limited transit. Inflation at ~ further increases consumer sensitivity to friction, raising reputational and compliance risk when enforcement actions disrupt supply or geofenced operations.
Opportunities
Electric vehicle fleet partnerships
EV integration is a forward-growth lever for ridesharing because it can improve operational consistency, help meet city and corporate sustainability requirements, and enable differentiated product tiers without requiring future projections. U.S. CO₂ emissions excluding land-use change are reported at ~ on a per-capita basis, indicating sustained policy and stakeholder pressure for lower-emission mobility solutions—an environment where EV-focused rideshare offerings can gain regulatory and enterprise traction. Infrastructure depth supports scaling: the U.S. has around ~ publicly available EV charging ports nationally, strengthening the feasibility of EV rideshare fleets in high-demand metros where charging density is highest. This sits within a large macro base of ~ population and ~ unemployment that sustains trip volumes needed for fleet utilization. Inflation at ~ reinforces the need for operational efficiency; EV partnerships can reduce downtime variability and support predictable deployment in airport-heavy or downtown-heavy geographies where demand is concentrated.
Robotaxi commercialization corridors
Robotaxi rollout is corridor-driven in the U.S. because commercialization depends on state permissions, city acceptance, and operational design domains that fit safety and weather constraints. State regulatory programs indicate that only ~ manufacturers are authorized for certain deployment categories, showing that approvals are limited and highly regulated, which naturally creates corridors where commercialization can occur first. The scale of U.S. roadway exposure—~ billion vehicle-miles traveled—makes automation attractive for improving consistency and reducing incident risk, but it also raises the bar for safe operations because automated systems must operate amid enormous real-world traffic volume. Safety oversight is formalized through crash-reporting requirements for automated driving systems, embedding transparency expectations into the commercialization pathway and shaping where and how deployments expand. Macro conditions support corridor economics: a population of ~, unemployment at ~, and inflation at ~ sustain high trip frequency while keeping consumers sensitive to reliability and friction, favoring early robotaxi routes where service levels can be tightly controlled.
Future Outlook
The USA ride-sharing services market is expected to grow steadily, driven by continued travel demand, deeper suburban penetration, and platform operational improvements that reduce cancellations and ETAs. A major structural catalyst is the accelerating integration of autonomous ride-hail through partnerships and city expansions, alongside electrification efforts that reduce operating cost volatility over time. At the same time, airports and large venues will remain critical battlegrounds where compliance, staging efficiency, and partnership depth determine reliability and unit economics. Competitive differentiation will increasingly hinge on supply quality, safety response maturity, and enterprise distribution.
Major Players
- Uber
- Lyft
- Waymo
- Via Transportation
- Curb Mobility
- Flywheel
- ARRO
- zTrip
- Wingz
- HopSkipDrive
- Alto
- Empower
- inDrive
- Blacklane
Key Target Audience
- Ride-sharing platforms and mobility marketplaces
- Fleet operators, vehicle leasing firms, and mobility fleet aggregators
- Automotive OEMs and EV manufacturers
- Auto insurance carriers and commercial mobility insurers
- Airports, venue operators, and travel infrastructure owners
- Corporate travel buyers and expense management or platform partners
- Investments and venture capitalist firms
- Government and regulatory bodies
Research Methodology
Step 1: Identification of Key Variables
We begin by mapping the ride-sharing ecosystem across platforms, drivers, fleets, airports, regulators, insurers, and payment partners. This is supported by structured desk research using filings, transport agency publications, and sector databases. The objective is to define variables that shape demand and supply.
Step 2: Market Analysis and Construction
Historical market performance is constructed using industry revenue tracking and platform operating indicators. We assess trip patterns by metro and use- case, pricing and fee stack structure, and operational KPIs such as cancellation and pickup-time drivers. This step also frames the market’s value chain.
Step 3: Hypothesis Validation and Expert Consultation
Working hypotheses on segmentation performance and competitive positioning are validated through expert consultations with operators, fleet managers, airport mobility stakeholders, and industry specialists. Inputs are used to confirm adoption drivers, regulatory constraints, and channel dynamics.
Step 4: Research Synthesis and Final Output
We triangulate the top-down industry view with bottom-up operational insights to finalize market sizing, segmentation splits, and competitive benchmarking. The output is stress-tested for consistency across demand indicators, platform economics, regulatory structures, and documented strategic moves.
- Executive Summary
- Research Methodology (Market Definitions and Assumptions, Abbreviations, Scope Boundary Ride hailing vs Taxi eHail vs Microtransit vs Robotaxi, Market Sizing Approach Top down mobility spend and Bottom up trips multiplied by AOV, Data Triangulation Framework, Primary Research Approach drivers fleets airports cities payers, Secondary Research Sources USDOT FHWA FTA city open data portals platform filings app intelligence, Interview Universe and Sampling Logic, Validation and Reconciliation Rules, Limitations and Future Conclusions)
- Definition and Scope
- Market Genesis and Evolution
- Industry Timeline of Major Players
- Business Cycle and Seasonality Patterns
- Operating Model Stack

- Growth Drivers
Urban congestion substitution
Airport and venue demand concentration
Smartphone and digital wallet penetration
Labor supply elasticity
Corporate travel recovery - Challenges
Driver acquisition and retention
Regulatory enforcement variability
Insurance cost inflation
Fraud and chargeback exposure
Safety and security incidents - Opportunities
Electric vehicle fleet partnerships
Robotaxi commercialization corridors
Healthcare and assisted transport expansion
Subscription and membership monetization
B2B dispatch licensing - Trends
Robotaxi pilots and phased scaling
Taxi eHail and legacy fleet integrations
Premium service tier expansion
Membership and bundled mobility offerings
Safety feature innovation race - Regulatory & Policy Landscape
- SWOT Analysis
- Stakeholder & Ecosystem Analysis
- Porter’s Five Forces Analysis
- Competitive Intensity & Ecosystem Mapping
- By Value, 2019–2024
- By Trips, 2019–2024
- By Average Order Value and Fare Mix, 2019–2024
- By Platform Revenue, 2019–2024
- By Fleet Type (in Value %)
Human driven vehicles
Electric vehicles
Hybrid vehicles
Autonomous vehicles
Wheelchair accessible vehicles - By Application (in Value %)
Airport transportation
Daily commuting
Leisure and nightlife travel
Event based transportation
Intercity travel - By Technology Architecture (in Value %)
Platform based dispatch systems
API enabled partner integrations
Autonomous driving stack integrated platforms
AI based dynamic pricing systems
Multimodal mobility platforms - By Connectivity Type (in Value %)
Mobile app based booking
Web based booking
API and enterprise system connectivity
In vehicle telematics connectivity
Smart payment and wallet integration - By End-Use Industry (in Value %)
Individual consumers
Corporate and business travel
Healthcare and assisted mobility
Educational institutions
Municipal and public sector programs - By Region (in Value %)
Northeast United States
Midwest United States
Southern United States
Western United States
Top metropolitan statistical areas
- Market share of major players by value and trips
Competitive positioning map - Cross Comparison Parameters (City and MSA coverage footprint and airport presence, Driver supply depth and utilization, Pickup performance metrics, Pricing mechanics and surge behavior, Safety and trust infrastructure, Insurance model and claims handling, Partnership and integration depth, Future readiness including EV and AV enablement)
- SWOT analysis of major players
- Pricing architecture benchmarking
- Growth strategy playbooks
- Risk and compliance benchmarking
- Detailed profiles of major companies
Uber
Lyft
Waymo
Via Transportation
Curb Mobility
Flywheel Technologies
ARRO
Creative Mobile Technologies
zTrip
Wingz
HopSkipDrive
Alto
Empower
inDrive
- Rider use cases and utilization patterns
- Corporate and institutional procurement behavior
- Airport and venue channel dynamics
- Rider pain points and decision journey
- Driver and fleet pain points and decision journey
- By Value, 2025–2030
- By Trips, 2025–2030
- By Average Order Value and Fare Mix, 2025–2030
- By Platform Revenue, 2025–2030


 Request a Sample
 Ask for Customization
 Get a Quote
 Enquire Now