
 Download PDF
 Download PDF
Market Overview
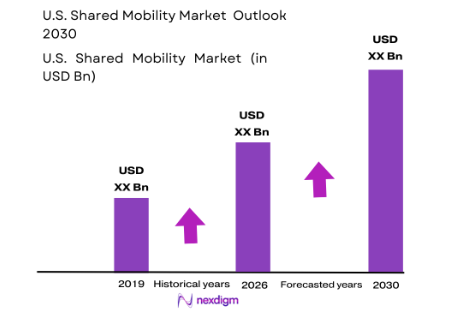
The U.S. shared mobility platforms market is valued at approximately USD ~billion, driven primarily by the rapid adoption of app-based mobility services such as ride-hailing, car-sharing, and micro-mobility solutions like e-scooters and bicycles. The market’s expansion is fuelled by the growing shift away from private car ownership towards flexible, on-demand transportation services, especially in urban areas. Factors such as increasing urbanization, rising fuel prices, and the adoption of electric vehicles (EVs) within these services are all significant contributors to the growing market size.
Major metropolitan areas such as New York, Los Angeles, Chicago, and San Francisco dominate the U.S. shared mobility market due to their high population density, reliance on public transport, and congestion. These cities offer high levels of mobility demand, driven by both tourists and daily commuters seeking affordable, eco-friendly transportation options. Additionally, California leads with its supportive policies towards green technology adoption, while other cities benefit from progressive infrastructure and a robust regulatory framework that supports innovative transport solutions.
Market Segmentation
By Service Type
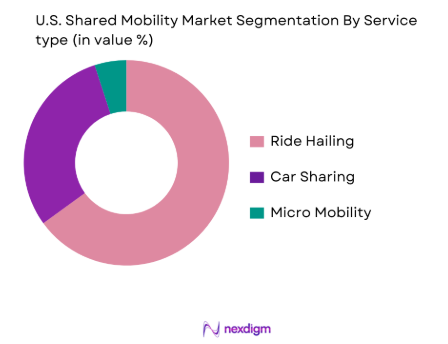
The U.S. shared mobility market is segmented by service type into ride-hailing, car sharing, and micro-mobility solutions. Ride-hailing remains a dominant sub-segment due to its widespread adoption and integration into daily urban life. Companies like Uber and Lyft have established themselves as industry leaders, providing consumers with the flexibility of on-demand rides via a mobile platform. This sector benefits from significant network effects where the value of the service increases as more users and drivers join the platform. The ride-hailing sub-segment is expected to maintain its market leadership, driven by increasing preference for convenient, low-cost alternatives to traditional taxis and personal car ownership.
By Vehicle Type
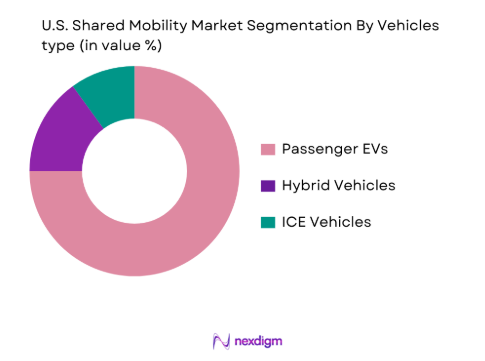
The shared mobility market is segmented by vehicle type into passenger electric vehicles (EVs), hybrid vehicles, and traditional internal combustion engine (ICE) vehicles. Passenger EVs are expected to dominate the vehicle type sub-segment. The growing focus on reducing carbon emissions, combined with favorable government incentives, has significantly increased the adoption of electric vehicles within shared fleets. Companies like Lyft and Uber have been gradually transitioning to EVs to meet both environmental goals and consumer demand for sustainable transport. The EV sub-segment benefits from technological advancements in battery life and charging infrastructure, allowing for greater market penetration.
Competitive Landscape
The U.S. shared mobility market is dominated by key players such as Uber, Lyft, Turo, Zipcar, and Bird. These companies control a substantial portion of the market, each with a strong foothold in their respective segments. Uber and Lyft dominate ride-hailing services with their large user base, while Turo and Zipcar are key players in car-sharing. Micro-mobility is heavily influenced by companies like Bird, Lime, and Spin, which have carved a niche in the e-scooter and e-bike rental space. Despite the competition, these companies remain dominant due to strong brand recognition, well-established networks, and continuous innovation in both services and pricing models.
| Company | Established Year | Headquarters | Service Type | Fleet Size | Revenue Model | Geographical Reach | Fleet Electrification |
| Uber | 2009 | San Francisco, CA | ~ | ~ | ~ | ~ | ~ |
| Lyft | 2012 | San Francisco, CA | ~ | ~ | ~ | ~ | ~ |
| Turo | 2010 | San Francisco, CA | ~ | ~ | ~ | ~ | ~ |
| Zipcar | 2000 | Boston, MA | ~ | ~ | ~ | ~ | ~ |
| Bird | 2017 | Santa Monica, CA | ~ | ~ | ~ | ~ | ~ |

U.S. Shared Mobility Platforms Market Analysis
Growth Drivers
Modal Shift from Private Ownership
In the U.S., the shift from private car ownership to shared mobility is becoming more pronounced, driven by both consumer preferences and urban policies. As of 2024, the number of privately owned vehicles per household in urban areas has decreased, especially in cities with strong ride-hailing infrastructure such as New York and San Francisco. According to the U.S. Census Bureau, 91.5% of households in urban areas did not own a car in 2025, which directly fuels demand for shared mobility options. As fuel prices rise and concerns over vehicle maintenance costs increase, individuals are increasingly opting for shared transportation services. With urbanization trends accelerating in 2025, this shift is expected to intensify further.
Congestion & Emission Reduction Policies
Cities like New York, San Francisco, and Washington D.C. are facing extreme congestion and high pollution levels. The congestion in these cities is exacerbated by an increase in vehicle ownership, leading to longer commute times and higher emission levels. According to the World Bank, traffic congestion in the U.S. has resulted in an annual loss of USD ~billion in productivity due to longer commute times. In response, cities are implementing stricter emission reduction policies. By 2024, cities are aiming to reduce their carbon footprint by adopting green mobility solutions. For instance, New York City aims to cut greenhouse gas emissions by 30% by 2030, supporting the growth of electric vehicle (EV) integration in shared mobility fleets.
Barriers & Challenges
Regulatory Compliance & Local Ordinances
While shared mobility platforms offer numerous benefits, they are often hindered by complex regulatory frameworks that vary from state to state. In major cities like San Francisco and New York, local ordinances impose strict regulations on the operations of ride-hailing and car-sharing services. For example, New York City requires ride-hailing services to follow strict insurance guidelines and limit the number of vehicles on the road in order to reduce congestion. The lack of standardized regulations across states complicates operations for shared mobility providers, increasing compliance costs. This regulatory fragmentation is expected to continue as cities strive to balance innovation with public safety concerns.
Insurance Risk & Claim Costs
As the shared mobility market grows, so does the complexity of managing insurance risks. In 2024, the U.S. insurance industry saw a rise in claims associated with shared mobility services, particularly in ride-hailing. A report by the Insurance Information Institute highlighted that claims for ride-hailing accidents have risen by 23% over the past three years, reflecting the increasing number of vehicles on the road and the complexities of insuring drivers who are not full-time employees. Insurance premiums for fleet owners have also seen upward adjustments due to the increased risk of accidents in dense urban environments.
Opportunities
Autonomous Vehicle Deployment & Robotaxi Integration
Autonomous vehicles (AVs) present a significant opportunity for the shared mobility market. AV technology has advanced substantially, with companies like Waymo and Cruise already operating autonomous taxis in cities like Phoenix and San Francisco. As of 2024, the U.S. Department of Transportation has approved pilot programs for robotaxis in multiple states. AVs can reduce operational costs for shared mobility platforms, as they eliminate the need for human drivers and improve fleet efficiency. The transition to autonomous vehicles is expected to revolutionize the market by providing more affordable, efficient, and sustainable transportation options.
Enterprise Shared Mobility Programs
Enterprises in the U.S. are increasingly adopting shared mobility programs to streamline their employee transportation. Companies like Google and Microsoft have implemented corporate ride-sharing programs to reduce parking costs and improve employee satisfaction. According to the U.S. General Services Administration, nearly 40% of major corporations in metropolitan areas have either implemented or plan to adopt shared mobility solutions by 2024. These programs allow businesses to reduce the carbon footprint of employee commutes while optimizing transportation costs. This growing trend among enterprises is expected to be a major driver for shared mobility providers targeting business clients.
Future Outlook
Over the next 5 years, the U.S. shared mobility market is expected to experience significant growth, driven by increasing adoption of electric vehicles (EVs), greater integration of mobility-as-a-service (Maas) platforms, and an ongoing shift toward on-demand transportation solutions. Rising environmental concerns, coupled with regulatory push towards reducing carbon emissions, will further accelerate the transition to electric shared fleets. Additionally, advancements in autonomous vehicle technologies will likely reshape the market, offering new opportunities for fully autonomous ride-hailing and micro-mobility services.
Major Players
- Uber
- Lyft
- Turo
- Zipcar
- Bird
- Lime
- Spin
- Get around
- Bolt
- Car2Go
- Voi Technology
- Ola Cabs
- Via
- Maven
- Gogoro
Key Target Audience
- Investments and Venture Capitalist Firms
- Government and Regulatory Bodies
- Transportation Infrastructure Companies
- Electric Vehicle Manufacturers
- Fleet Management Companies
- Shared Mobility Platform Operators
- Insurance Companies for Fleet Risk Management
- Municipal Urban Planning Agencies
Research Methodology
Step 1: Identification of Key Variables
In this phase, we conduct extensive desk research, utilizing primary and secondary databases to construct an ecosystem map of stakeholders within the U.S. shared mobility market. The goal is to identify and define key variables such as service types, vehicle electrification rates, and geographical hotspots that influence market dynamics.
Step 2: Market Analysis and Construction
This phase involves the collection and analysis of historical data concerning service utilization, fleet deployment, market penetration, and financial performance. We will also assess operational data, including fleet size and customer engagement metrics, to support accurate market sizing.
Step 3: Hypothesis Validation and Expert Consultation
Market hypotheses are validated through in-depth interviews with industry experts, fleet operators, and regulatory bodies. These consultations provide essential insights into market trends, challenges, and future opportunities, allowing for a more refined and accurate assessment of the market.
Step 4: Research Synthesis and Final Output
The final research phase includes synthesizing all gathered information, conducting detailed interviews with industry leaders and policymakers, and verifying key findings through direct engagements. This process ensures the report provides an accurate and comprehensive view of the U.S. shared mobility market.
- Executive Summary
- Research Methodology (Market Definitions, Shared Mobility Service Taxonomy, Assumptions, Abbreviations, Data Sources, Primary & Secondary Research Matrix, Market Sizing Logic, Forecasting & Extrapolation Techniques, Confidence & Error Bounds)
- Shared Mobility Definition & Service Taxonomy
- Market Genesis & Structural Evolution in U.S. Urban Mobility
- Adoption Funnel & Usage Patterns
- Core Market Forces: Urbanization, Fuel Cost Dynamics, EV Integration

- Growth Drivers
Modal Shift from Private Ownership
Congestion & Emission Reduction Policies
EV Fleet Penetration & Charging Infrastructure
Integration with Public Transit - Barriers & Challenges
Regulatory Compliance & Local Ordinances
Insurance Risk & Claim Costs
Driver Supply & Labor Costs - Opportunities
Autonomous Vehicle Deployment & Robotaxi Integration
Enterprise Shared Mobility Programs
Cross‑Platform Interoperability - Government Policies, Regulation & Standards
Federal & State Shared Mobility Policies
EV Emission Mandates & Incentives
Safety, Data Privacy & Ride Insurance Regulations
- By Market Value, 2019-2025
- By Total Trips & Active Users, 2019-2025
- By Average Revenue per Trip, 2019-2025
- By Fleet Size & Operational Geographies, 2019-2025
- By Service Type (In Value %)
Ride‑Hailing
Car Sharing
Micro‑Mobility
Multi‑Modal Aggregators / Maas
- By Vehicle / Asset Type (In Value %)
Passenger EVs
Hybrid & ICE Vehicles
E‑Scooters & E‑Bicycles
Autonomous Test Fleets
- By Customer Type (In Value %)
Urban Commuters
Corporate & Enterprise Mobility Programs
Tourists & Occasional Users - By Pricing Model (In Value %)
Pay‑Per‑Use
Subscription / Pass Models
Dynamic Surge / Peak Pricing
- By Operating Region / Urban Density (In Value %)
Tier‑1 Metropolitan Areas
Mid‑Size Cities
Suburban Networks
- Market Share Analysis
- Cross‑Comparison Parameters (Business Model Archetype Service Coverage Density, Fleet Electrification %, Platform Monetization KPIs, User Retention & Churn Rates, Driver Partner Economics & Incentive Structures, API & Third‑Party Integration Depth, Insurance & Risk Mitigation Profiles)
- SWOT Analysis
- Pricing & Revenue Models
- Porter’s Five Forces
- Detailed Company Profile
Uber
Lyft
Zipcar
Get around
Turo
Lime
Bird
Spin
Veo
Curb Mobility
Wingz
Waymo
May Mobility
Zoox
Bolt
- Trip Purpose Analysis
- User Segmentation by Frequency & Revenue Contribution
- Preferences for Mode Substitution & Loyalty Programs
- Forecast Methodology, 2026-2030
- Market Value & Trip Volume Projections, 2026-2030
- Scenario Analysis, 2026-2030


 Request a Sample
 Ask for Customization
 Get a Quote
 Enquire Now