
 Download PDF
 Download PDF
Market Overview
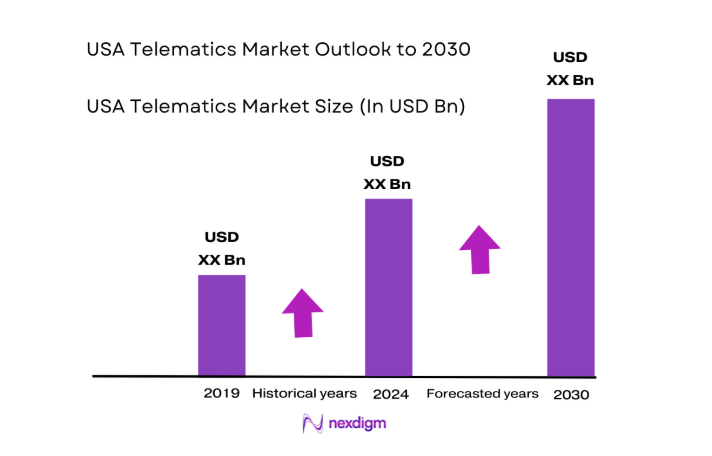
The USA Telematics market current size stands at around USD ~ million, reflecting a mature connected mobility ecosystem anchored by large commercial fleets, embedded vehicle platforms, and insurance-linked telematics programs. Market activity is shaped by sustained device refresh cycles, expanding analytics adoption, and multi-year platform contracts across logistics, utilities, and field services. Value creation centers on data-driven safety, compliance, and operational optimization delivered through integrated hardware, connectivity, and software services across diversified vehicle classes and operational profiles nationwide.
Deployment density is highest across logistics corridors and metropolitan regions such as Southern California, the Texas Triangle, the Northeast megalopolis, and the Midwest freight belt, where fleet intensity, distribution infrastructure, and service networks are concentrated. Urban congestion, last-mile delivery growth, and safety compliance regimes accelerate adoption. A mature installer ecosystem, strong cellular coverage, and established OEM partnerships reinforce regional leadership, while state-level privacy frameworks and transportation safety policies shape implementation models.
Market Segmentation
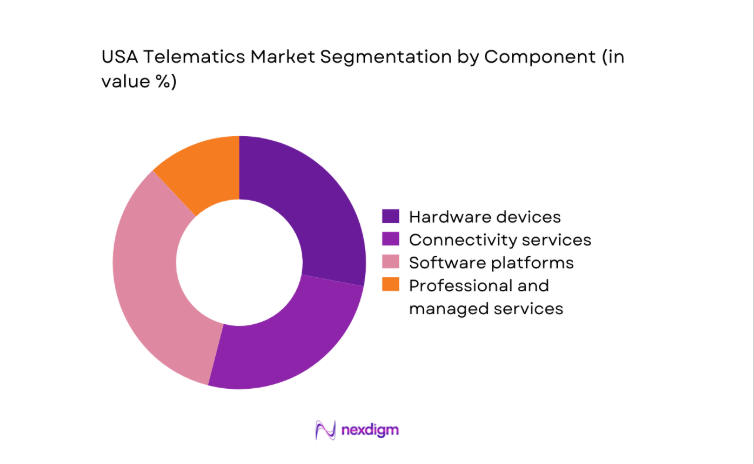
By Component
Component mix is led by software platforms and connectivity services due to recurring service requirements across fleet operations, insurance programs, and OEM-embedded solutions. Platform adoption deepens as operators consolidate dispatch, safety scoring, diagnostics, and compliance into unified dashboards, reducing tool sprawl. Connectivity services expand with multi-network roaming and private APN deployments to support continuous data streams for video telematics and diagnostics. Hardware remains essential for aftermarket fleets and video capture but faces commoditization pressure. Professional and managed services gain relevance during large-scale rollouts, systems integration with TMS and ERP, and compliance audits, particularly for regulated fleets operating across multiple states.
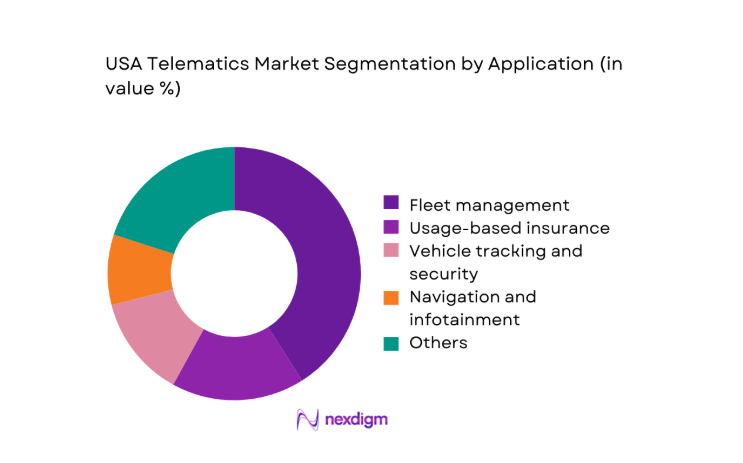
By Application
Fleet management dominates application demand as operators prioritize safety, compliance, fuel efficiency, and utilization optimization across mixed vehicle classes. Video telematics adoption strengthens incident management and coaching, while diagnostics reduce unplanned downtime through proactive maintenance workflows. Usage-based insurance expands among commercial and consumer segments, supported by telematics-driven risk scoring and claims workflows. Security and recovery solutions remain relevant in high-theft corridors. Navigation and infotainment contribute incremental value through route optimization and driver experience improvements. Predictive maintenance and EV fleet orchestration are emerging use cases, integrating charging workflows and energy optimization with vehicle telemetry across depot-centric operations.
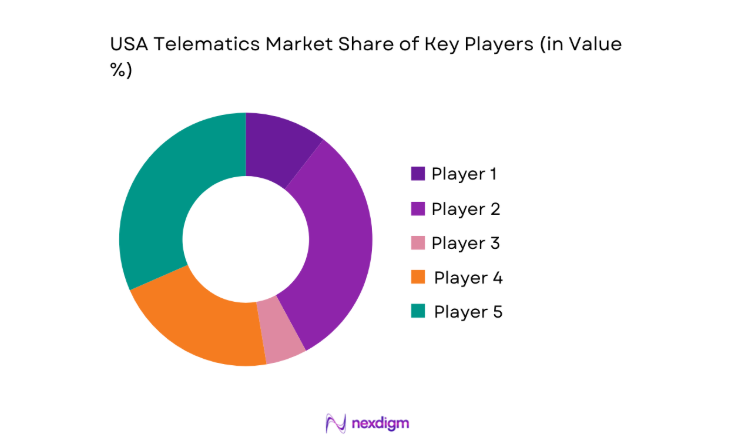
Competitive Landscape
The competitive environment features platform-centric providers competing on analytics depth, ecosystem integrations, service reliability, and compliance readiness, with differentiation shaped by vertical specialization and deployment scale across commercial fleets, insurers, and OEM-linked programs.
| Company Name | Establishment Year | Headquarters | Formulation Depth | Distribution Reach | Regulatory Readiness | Service Capability | Channel Strength | Pricing Flexibility |
| Geotab | 2000 | Canada | ~ | ~ | ~ | ~ | ~ | ~ |
| Verizon Connect | 2002 | United States | ~ | ~ | ~ | ~ | ~ | ~ |
| Samsara | 2015 | United States | ~ | ~ | ~ | ~ | ~ | ~ |
| Omnitracs | 1988 | United States | ~ | ~ | ~ | ~ | ~ | ~ |
| Trimble Transportation | 1978 | United States | ~ | ~ | ~ | ~ | ~ | ~ |
USA Telematics Market Analysis
Growth Drivers
Rising adoption of fleet digitization and real-time vehicle monitoring
Fleet digitization in the United States is accelerating as compliance frameworks and operational digitization expand across commercial transport. Federal mandates affecting driver hours and safety reporting increased inspections to 3100000 in 2023, up from 2950000 in 2022, prompting real-time monitoring adoption. Urban congestion hours per commuter reached 51 in 2024 across major metros, raising routing optimization demand. Cellular network upgrades expanded 5G coverage across 19000 municipalities by 2024, enabling video telematics reliability. Public infrastructure programs supported deployment of 120000 roadside sensors by 2023, improving data interoperability. Fleet safety incidents reported to transportation authorities rose to 470000 in 2024, intensifying continuous monitoring requirements.
Expansion of usage-based insurance programs by auto insurers
Usage-based insurance adoption is expanding as regulatory approvals and actuarial acceptance mature across states. By 2024, telematics-enabled policies were authorized in 48 jurisdictions, up from 44 in 2022, broadening addressable participation. Claims processing digitization reduced average settlement cycles to 21 days in 2024 from 28 in 2022, strengthening insurer incentives for real-time driving data. Connected policy enrollments exceeded 12000000 active vehicles in 2023, reflecting consumer acceptance of data-sharing programs. State departments of transportation recorded 42000 severe injury crashes in 2024, reinforcing risk-based underwriting interest. Cloud processing capacity in insurance workflows increased by 180000 virtual cores across carriers during 2023.
Challenges
Data privacy and consent management complexity across states
State-level privacy regimes create operational complexity for telematics deployments as consent frameworks differ across jurisdictions. By 2024, 12 states enacted comprehensive consumer privacy statutes, up from 5 in 2022, increasing compliance overhead. Transportation agencies processed 680000 data access requests in 2023 related to connected vehicle records, raising governance burdens. Cross-border fleet operations span 50 jurisdictions with differing retention rules, increasing policy fragmentation. Regulatory audits of digital data handling rose to 9400 actions in 2024, compared with 6100 in 2022. Enterprise compliance teams expanded headcount by 23 per organization on average in 2023 to manage consent workflows, incident response, and breach notification obligations.
Interoperability issues between OEM and aftermarket platforms
Platform fragmentation constrains seamless data flows between embedded OEM systems and aftermarket telematics stacks. By 2024, fleets reported integrating 6 distinct data schemas on average, up from 4 in 2022, increasing integration latency. API versioning conflicts caused 180000 service interruptions reported to industry associations in 2023. Firmware update cycles across mixed fleets averaged 9 months in 2024, delaying feature parity. Standards bodies published 14 new connected vehicle interface specifications in 2023, reflecting ongoing convergence gaps. Integration backlogs across logistics operators exceeded 1200 open tickets per enterprise in 2024, constraining analytics continuity, driver coaching workflows, and compliance reporting timeliness across distributed operations nationwide.
Opportunities
AI-driven predictive maintenance and asset health analytics
Predictive maintenance powered by machine learning is expanding as fleets digitize maintenance workflows and sensor coverage increases. In 2024, connected diagnostics captured 2.1 billion fault codes across commercial vehicles, up from 1.6 billion in 2022, enabling model training at scale. Maintenance-related roadside incidents recorded by transportation authorities declined to 86000 in 2024 from 104000 in 2022, signaling value in early detection. Public research grants supported 320 applied AI projects in vehicle health analytics during 2023. Edge computing deployments in depots increased to 7400 sites by 2024, reducing inference latency. Institutional safety programs reported 19 guideline updates in 2023 incorporating predictive maintenance practices.
Telematics-enabled electrification and EV fleet optimization
Fleet electrification creates demand for telematics-integrated energy and asset orchestration across depots and routes. Public charging infrastructure expanded to 182000 ports in 2024 from 132000 in 2022, necessitating route-aware charging optimization. Utility interconnection approvals for depot chargers reached 21000 in 2023, accelerating fleet transitions. Grid operators deployed 4600 smart transformers by 2024 to support managed charging programs. Municipal procurement programs added 28000 electric commercial vehicles in 2023, increasing telemetry requirements for battery health and duty-cycle planning. Federal fleet transition milestones scheduled through 2025 reinforce sustained demand for telematics-enabled energy management, charging scheduling, and range assurance across mixed-fuel operations.
Future Outlook
The market outlook through 2030 reflects sustained digitization of fleets, deeper OEM data integration, and expanding insurance-linked telematics adoption. Regulatory harmonization across states and maturation of privacy frameworks will shape deployment models. Video analytics, AI-driven maintenance, and EV fleet orchestration will drive platform differentiation. Ecosystem partnerships across logistics, utilities, and mobility platforms will strengthen integrated value creation.
Major Players
- Geotab
- Verizon Connect
- Samsara
- Omnitracs
- Trimble Transportation
- Teletrac Navman
- CalAmp
- Fleet Complete
- Azuga
- Spireon
- Lytx
- Motive
- Zonar Systems
- Sierra Wireless
- Mix Telematics
Key Target Audience
- Commercial fleet operators and logistics companies
- Automotive OEMs and connected vehicle program managers
- Auto insurance carriers and underwriting teams
- System integrators and managed service providers
- Telematics hardware installers and reseller networks
- Investments and venture capital firms
- Government and regulatory bodies with agency names such as the U.S. Department of Transportation and Federal Motor Carrier Safety Administration
- Municipal and state fleet procurement agencies
Research Methodology
Step 1: Identification of Key Variables
Key variables were defined across applications, components, vehicle classes, deployment models, and regulatory constraints shaping telematics adoption in the United States. Signal sources included operational workflows, compliance touchpoints, connectivity dependencies, and data governance requirements. Variables were structured to reflect fleet operations, insurance-linked programs, and OEM-embedded systems.
Step 2: Market Analysis and Construction
The analytical framework mapped value creation across hardware, connectivity, platforms, and services, aligning with ecosystem roles and deployment pathways. Interoperability constraints, privacy regimes, and infrastructure readiness were embedded as structural factors. Scenario construction reflected logistics intensity, urban mobility patterns, and EV transition pathways across regions.
Step 3: Hypothesis Validation and Expert Consultation
Hypotheses were stress-tested through structured consultations with fleet operations leaders, safety program administrators, compliance officers, and mobility infrastructure planners. Validation emphasized operational feasibility, regulatory readiness, and data governance impacts. Iterative feedback refined assumptions around adoption frictions, integration timelines, and service delivery models.
Step 4: Research Synthesis and Final Output
Findings were synthesized into coherent narratives linking regulatory drivers, infrastructure maturity, and technology pathways. Cross-validation ensured internal consistency across segmentation, competitive dynamics, and future outlooks. The final output emphasizes decision-relevant insights for operators, insurers, OEM partners, and ecosystem stakeholders.
- Executive Summary
- Research Methodology (Market Definitions and telematics service scope mapping, OEM embedded telematics data partnerships, Fleet operator surveys and telematics usage telemetry, Insurance telematics program audits and claims data linkage, Channel interviews with installers and resellers, Platform vendor financials and contract analysis)
- Definition and Scope
- Market evolution
- Usage pathways across fleet, insurance, and consumer mobility
- Ecosystem structure
- Supply chain and channel structure
- Regulatory environment

- Growth Drivers
Rising adoption of fleet digitization and real-time vehicle monitoring
Expansion of usage-based insurance programs by auto insurers
OEM integration of embedded telematics in new vehicle models
Regulatory pressure on electronic logging and driver safety compliance
Demand for fuel optimization and route efficiency in logistics
Growth of connected car services and mobility platforms - Challenges
Data privacy and consent management complexity across states
Interoperability issues between OEM and aftermarket platforms
High upfront hardware and installation costs for legacy fleets
Network coverage gaps in rural and remote operating regions
Cybersecurity risks to connected vehicle systems
Fragmented standards and APIs across telematics vendors - Opportunities
AI-driven predictive maintenance and asset health analytics
Telematics-enabled electrification and EV fleet optimization
Integration with TMS, ERP, and insurance underwriting systems
Subscription-based analytics for small and mid-sized fleets
Smart city partnerships for traffic and safety data monetization
Advanced video telematics and ADAS data services - Trends
Shift from hardware-led sales to SaaS platform revenues
Rising adoption of video telematics and driver monitoring cameras
OEM–platform partnerships for data access and monetization
Move toward usage-based pricing and outcome-based contracts
Integration of telematics with EV charging and energy management
Growing focus on real-time compliance and safety scoring - Government Regulations
- SWOT Analysis
- Stakeholder and Ecosystem Analysis
- Porter’s Five Forces Analysis
- Competition Intensity and Ecosystem Mapping
- By Value, 2019–2024
- By Volume, 2019–2024
- By Active Systems, 2019–2024
- By Revenue per Unit, 2019–2024
- By Component (in Value %)
Hardware devices
Connectivity services
Software platforms
Professional and managed services - By Technology (in Value %)
OBD-based devices
Embedded OEM telematics
Smartphone-based telematics
Aftermarket black-box units - By Vehicle Type (in Value %)
Passenger cars
Light commercial vehicles
Medium and heavy commercial vehicles
Off-highway and specialty vehicles - By Application (in Value %)
Fleet management
Usage-based insurance
Vehicle tracking and security
Navigation and infotainment
Predictive maintenance and diagnostics
Driver safety and behavior monitoring - By End User (in Value %)
Commercial fleets
Insurance providers
Automotive OEMs
Logistics and transportation companies
Government and public sector fleets
Consumers and prosumers
- Market structure and competitive positioning
Market share snapshot of major players - Cross Comparison Parameters (Product breadth, Platform scalability, Data analytics capabilities, Integration ecosystem, Pricing flexibility, Customer support SLAs, Compliance and security posture, Geographic coverage)
- SWOT Analysis of Key Players
- Pricing and Commercial Model Benchmarking
- Detailed Profiles of Major Companies
Geotab
Verizon Connect
Samsara
Omnitracs
CalAmp
Teletrac Navman
Trimble Transportation
Fleet Complete
Azuga
Spireon
Mix Telematics
Lytx
Motive
Zonar Systems
Sierra Wireless
- Demand and utilization drivers
- Procurement and tender dynamics
- Buying criteria and vendor selection
- Budget allocation and financing preferences
- Implementation barriers and risk factors
- Post-purchase service expectations
- By Value, 2025–2030
- By Volume, 2025–2030
- By Active Systems, 2025–2030
- By Revenue per Unit, 2025–2030


 Request a Sample
 Ask for Customization
 Get a Quote
 Enquire Now