
 Download PDF
Market Overview
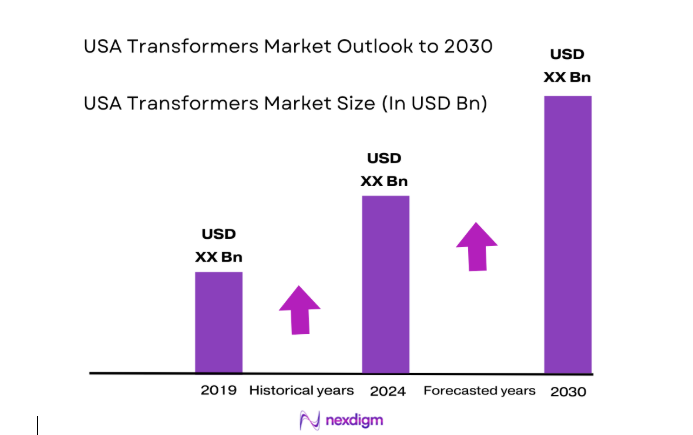
The USA Transformers Market current size stands at around USD ~ million, reflecting sustained replacement cycles across aging grid infrastructure and expanding electrification programs. Demand is shaped by utility-led upgrades, industrial substation expansions, and renewable interconnection projects. Supply dynamics remain constrained by long lead times for high-voltage units and material availability, while domestic manufacturing expansion is gradually improving responsiveness. Procurement practices emphasize lifecycle performance, reliability under peak loads, and compliance with evolving efficiency and safety standards.
Deployment intensity remains highest across Texas, California, Florida, New York, and the Mid-Atlantic corridor due to dense load centers, data center clusters, and renewable interconnection needs. The Midwest shows strong activity linked to transmission buildouts supporting wind integration. Gulf Coast industrial hubs drive demand for heavy-duty units supporting refining and petrochemicals. Western states prioritize wildfire resilience upgrades and undergrounding initiatives, while Northeast urban centers emphasize compact, dry-type installations within constrained substations.
Market Segmentation
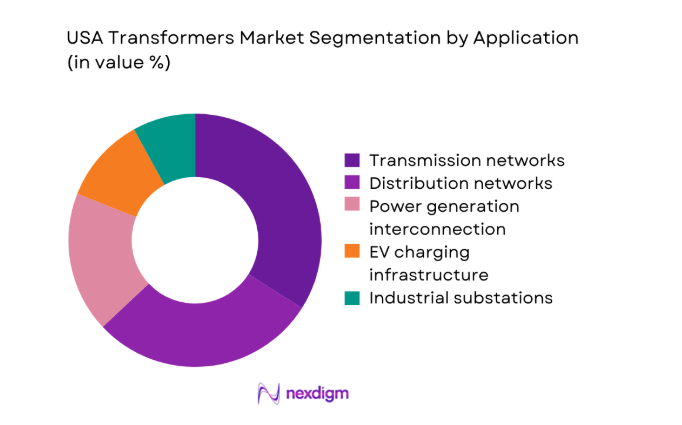
By Application
Grid modernization and resilience programs dominate adoption due to accelerated replacement of aging transmission and distribution assets, increased interconnection of renewables, and reinforcement of substations serving data centers and electrified transport corridors. Utilities prioritize high-reliability configurations for storm hardening and wildfire mitigation, while industrial buyers focus on uptime for continuous processes. EV charging networks and energy storage interconnections add incremental demand for medium-voltage units. The convergence of policy-driven grid hardening, interconnection queues, and reliability mandates sustains steady procurement cycles across regulated utilities and large industrial operators nationwide.
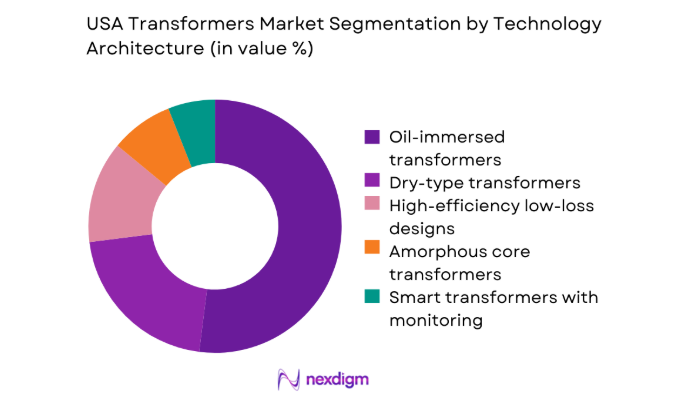
By Technology Architecture
Oil-immersed designs retain dominance in high-capacity transmission and outdoor substations due to thermal performance and lifecycle familiarity among utilities. Dry-type installations expand in urban, indoor, and safety-sensitive environments driven by fire risk mitigation and space constraints. Amorphous core adoption grows where utilities mandate lower no-load losses, while smart transformers with embedded monitoring gain traction in digital substations supporting predictive maintenance. Procurement balances reliability, safety compliance, and total lifecycle performance, with utilities standardizing specifications to streamline maintenance and spares across geographically dispersed fleets.
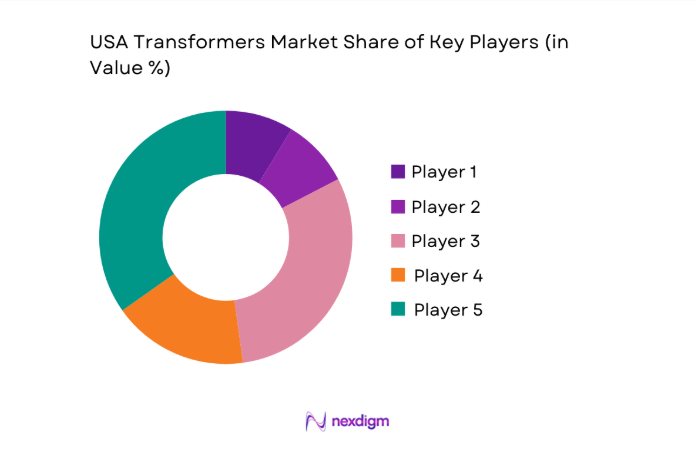
Competitive Landscape
Competition is shaped by utility qualification requirements, delivery lead-time reliability, and service coverage across regional grids. Buyers prioritize vendors with proven domestic manufacturing capacity, established service networks, and compliance with evolving efficiency and safety standards. Long-term framework agreements and preferred vendor lists influence competitive positioning, while aftermarket service capability differentiates suppliers during outage response and refurbishment cycles.
| Company Name | Establishment Year | Headquarters | Formulation Depth | Distribution Reach | Regulatory Readiness | Service Capability | Channel Strength | Pricing Flexibility |
| ABB | 1988 | Switzerland | ~ | ~ | ~ | ~ | ~ | ~ |
| Siemens Energy | 2020 | Germany | ~ | ~ | ~ | ~ | ~ | ~ |
| Hitachi Energy | 2021 | Switzerland | ~ | ~ | ~ | ~ | ~ | ~ |
| GE Vernova | 2024 | United States | ~ | ~ | ~ | ~ | ~ | ~ |
| Eaton | 1911 | Ireland | ~ | ~ | ~ | ~ | ~ | ~ |
USA Transformers Market Analysis
Growth Drivers
Grid modernization and resilience investments by U.S. utilities
Utilities expanded capital programs to harden transmission corridors after 2022 wildfire and storm disruptions affecting 19 states. Federal infrastructure allocations enacted in 2021 accelerated project approvals through 2023, while interconnection backlogs exceeded 2000 queued projects by 2024, driving substation reinforcement. Transmission additions of 3200 miles in 2023 increased demand for high-capacity units supporting voltage regulation. Distribution automation expanded across 38 states by 2024, raising deployment of digitally monitored assets. Extreme weather events numbered 28 in 2023, increasing replacement cycles. State resilience mandates in California, Texas, and Florida tightened reliability requirements, accelerating fleet upgrades across urban and rural networks.
Rising electricity demand from data centers and AI infrastructure
Data center electricity consumption increased by 37 from 2022 to 2024 across major hubs including Northern Virginia, Texas, and Arizona, intensifying substation capacity requirements. Hyperscale campuses commissioned 24 new facilities in 2023 and 19 in 2024, requiring dedicated medium-voltage feeders and step-down units. Grid operators approved 140 interconnection requests linked to compute clusters in 2024, while utility load forecasts revised peak demand upward in 11 regions. Cooling retrofits elevated continuous load profiles, necessitating higher thermal ratings. Zoning approvals in 7 metropolitan areas accelerated campus clustering near transmission nodes, concentrating deployment of high-reliability transformer configurations.
Challenges
Long manufacturing lead times and capacity constraints
Lead times for high-voltage units extended to 60 weeks during 2023 due to constrained electrical steel supply and limited winding capacity. Domestic facilities added 4 new production lines in 2024, yet backlogs persisted across 26 states. Port congestion in 2022 and 2023 disrupted inbound components, while transformer core lamination shortages affected assembly schedules. Utility outage response plans recorded 118 deferred replacements in 2024 tied to delivery slippage. Workforce gaps remained acute, with 2300 unfilled technical roles reported across manufacturing clusters. Qualification testing queues at accredited labs exceeded 14 weeks in 2024, slowing commissioning cycles.
Supply chain dependence on electrical steel and core materials
Electrical steel output volatility in 2022 and 2023 constrained transformer core availability, with mill maintenance outages affecting 3 major suppliers. Import lead times for specialized laminations exceeded 12 weeks during 2024, increasing project risk. Logistics disruptions across Gulf and Pacific ports affected component delivery schedules across 9 states. Material price swings in 2023 triggered contract renegotiations, delaying procurement approvals within regulated utilities. Recycling of copper windings rose by 21 in 2024 as manufacturers sought material security. Strategic inventory policies expanded to 90 days of coverage in 2024, raising storage burdens and working capital exposure for suppliers.
Opportunities
Domestic manufacturing expansion driven by reshoring initiatives
Federal incentives introduced in 2022 supported factory upgrades across 6 manufacturing clusters by 2024, enabling capacity additions aligned with utility qualification requirements. Workforce training programs certified 1800 technicians in 2023 and 2024, improving throughput and quality control. Regional economic development agencies approved 14 site expansions supporting heavy electrical equipment production. Interagency permitting reforms shortened facility approvals to 9 months in 2024. Local sourcing mandates in 5 states increased preference for domestically produced components. Co-location near transmission corridors reduced logistics times by 18 in pilot deployments, improving outage response readiness and lifecycle service coordination.
Demand for high-efficiency and low-loss transformer technologies
Updated efficiency standards implemented in 2023 elevated adoption of low-loss designs across utility procurement frameworks in 22 states. Utility asset management systems recorded 4600 retrofits aligned with loss-reduction targets during 2024. Grid decarbonization plans in 12 jurisdictions emphasized lifecycle energy performance, reinforcing procurement of advanced core materials. Monitoring deployments expanded to 31 utilities by 2024, enabling condition-based maintenance that improves asset utilization. Urban substation constraints drove compact designs across 9 metro areas. State resilience programs prioritized thermal performance under sustained peak loads observed during 2022 heat events affecting 5 regions.
Future Outlook
The market trajectory remains anchored to grid hardening, renewable interconnections, and electrification of transport and industry through 2030. Policy-driven transmission buildouts and digital substation adoption will sustain procurement cycles. Supply chain localization and workforce development will gradually ease delivery constraints. Regional resilience mandates will continue shaping technology preferences, while asset health monitoring expands lifecycle optimization across utility fleets.
Major Players
- ABB
- Siemens Energy
- Hitachi Energy
- GE Vernova
- Schneider Electric
- Eaton
- Mitsubishi Electric
- Hyosung Heavy Industries
- Toshiba Energy Systems & Solutions
- SPX Transformer Solutions
- Howard Industries
- Prolec GE
- Virginia Transformer Corp
- Waukesha Transformers
- Elsewedy Electric
Key Target Audience
- Electric utilities and transmission operators
- Independent power producers and renewable developers
- Data center owners and hyperscale operators
- Industrial and manufacturing facility operators
- Engineering, procurement, and construction contractors
- Investments and venture capital firms
- Federal Energy Regulatory Commission and state public utility commissions
- State energy offices and environmental protection agencies
Research Methodology
Step 1: Identification of Key Variables
Asset classes, voltage tiers, cooling technologies, and end-use applications were defined to reflect utility and industrial deployment contexts. Regulatory standards and qualification criteria were mapped to procurement pathways. Supply chain dependencies and manufacturing capacity variables were established to frame delivery feasibility.
Step 2: Market Analysis and Construction
Project pipelines, interconnection approvals, and utility capital plans were synthesized to construct deployment baselines. Infrastructure resilience programs and renewable buildouts were integrated to map demand centers. Technology adoption pathways were structured by application environment and compliance requirements.
Step 3: Hypothesis Validation and Expert Consultation
Operational assumptions were validated through consultations with grid planners, substation engineers, and maintenance leaders. Scenario testing assessed sensitivity to extreme weather frequency, interconnection backlogs, and manufacturing throughput. Findings were reconciled against institutional indicators and regulatory milestones.
Step 4: Research Synthesis and Final Output
Inputs were triangulated to ensure coherence across deployment, technology, and supply constraints. Narrative synthesis emphasized practical procurement dynamics and operational risks. Conclusions were structured to support strategic planning, sourcing decisions, and lifecycle management priorities.
- Executive Summary
- Research Methodology (Market Definitions and scope for power, distribution, and specialty transformers across U.S. grid and industrial networks, Segmentation taxonomy by power rating, voltage class, cooling method, and application across utility and industrial deployments, Bottom-up market sizing using utility capex programs, T&D project pipelines, and OEM shipment tracking, Revenue attribution based on transformer ASPs by kVA class and utility versus industrial contract pricing)
- Definition and Scope
- Market evolution
- Usage and deployment pathways
- Ecosystem structure
- Supply chain and channel structure
- Regulatory environment

- Growth Drivers
Grid modernization and resilience investments by U.S. utilities
Rising electricity demand from data centers and AI infrastructure
Expansion of renewable energy and interconnection capacity
Electrification of transportation and EV charging networks
Replacement of aging transformer fleet with efficiency upgrades
Federal and state funding for transmission and distribution upgrades - Challenges
Long manufacturing lead times and capacity constraints
Supply chain dependence on electrical steel and core materials
Skilled labor shortages in transformer manufacturing and installation
Permitting and right-of-way delays for grid expansion projects
High upfront capital costs for high-voltage power transformers
Exposure to commodity price volatility and logistics disruptions - Opportunities
Domestic manufacturing expansion driven by reshoring initiatives
Demand for high-efficiency and low-loss transformer technologies
Retrofit and replacement programs for aging distribution networks
Growth in digital substations and smart grid deployments
Aftermarket services for maintenance, refurbishment, and monitoring
Specialized transformers for renewable and hydrogen projects - Trends
Adoption of amorphous core and low-loss designs
Integration of online condition monitoring and diagnostics
Shift toward dry-type transformers in urban and indoor installations
Standardization of transformer specifications by utilities
Localization of supply chains and component sourcing
Lifecycle management and asset health analytics adoption - Government Regulations
- SWOT Analysis
- Stakeholder and Ecosystem Analysis
- Porter’s Five Forces Analysis
- Competition Intensity and Ecosystem Mapping
- By Value, 2019–2024
- By Volume, 2019–2024
- By Fleet Type (in Value %)
Power transformers
Distribution transformers
Instrument transformers
Specialty and traction transformers - By Application (in Value %)
Power generation interconnection
Transmission networks
Distribution networks
EV charging infrastructure
Renewable energy integration
Industrial substations - By Technology Architecture (in Value %)
Oil-immersed transformers
Dry-type transformers
Amorphous core transformers
High-efficiency low-loss transformers
Smart transformers with monitoring - By End-Use Industry (in Value %)
Electric utilities
Renewable energy developers
Manufacturing and heavy industry
Commercial and data centers
Transportation and rail
Oil and gas and mining - By Connectivity Type (in Value %)
Standalone transformers
SCADA-integrated transformers
IoT-enabled condition monitoring
Digital substation integrated units
Remote monitoring platforms - By Region (in Value %)
Northeast
Midwest
South
West
Pacific Coast
- Market structure and competitive positioning
Market share snapshot of major players - Cross Comparison Parameters (product portfolio breadth, voltage and power rating coverage, domestic manufacturing footprint, delivery lead times, pricing competitiveness, utility qualification and approvals, digital monitoring capabilities, aftermarket service network)
- SWOT Analysis of Key Players
- Pricing and Commercial Model Benchmarking
- Detailed Profiles of Major Companies
ABB
Siemens Energy
Hitachi Energy
GE Vernova
Schneider Electric
Eaton
Mitsubishi Electric
Hyosung Heavy Industries
Toshiba Energy Systems & Solutions
SPX Transformer Solutions
Howard Industries
Prolec GE
Virginia Transformer Corp
Waukesha Transformers
Elsewedy Electric
- Demand and utilization drivers
- Procurement and tender dynamics
- Buying criteria and vendor selection
- Budget allocation and financing preferences
- Implementation barriers and risk factors
- Post-purchase service expectations
- By Value, 2025–2030
- By Volume, 2025–2030


 Request a Sample
 Ask for Customization
 Get a Quote
 Enquire Now