
 Download PDF
 Download PDF
Market Overview
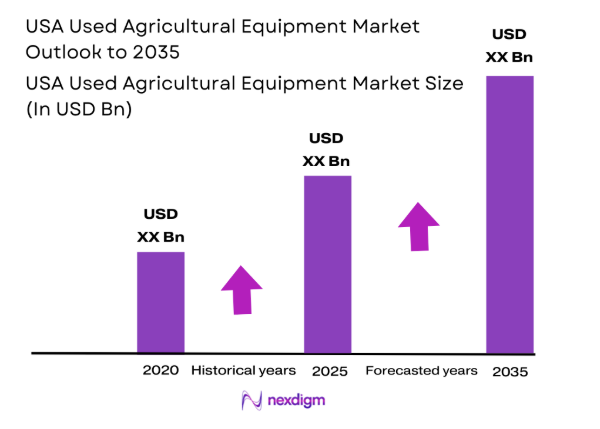
The USA Used Agricultural Equipment market current size stands at around USD ~ million, reflecting sustained demand for cost-efficient mechanization solutions across diverse farm sizes. Transaction activity is supported by mature dealer networks, certified pre-owned programs, and auction platforms that enhance equipment liquidity. Financing availability, refurbishment services, and telematics-enabled condition assessment improve buyer confidence. Inventory churn remains influenced by replacement cycles and fleet upgrades, while aftermarket service depth supports extended equipment life across operating conditions.
Demand concentration is strongest across the Midwest corn belt, Central Valley specialty crop clusters, and Southern livestock corridors, supported by dense dealer footprints and logistics access. Equipment flows benefit from proximity to refurbishment centers, auction yards, and transport hubs. Regions with advanced service infrastructure and financing ecosystems exhibit higher transaction velocity. Policy environments that emphasize emissions compliance and safety retrofits shape refurbishment standards, while state-level agricultural incentives and rural development programs reinforce secondary market participation.
Market Segmentation
By Equipment Type
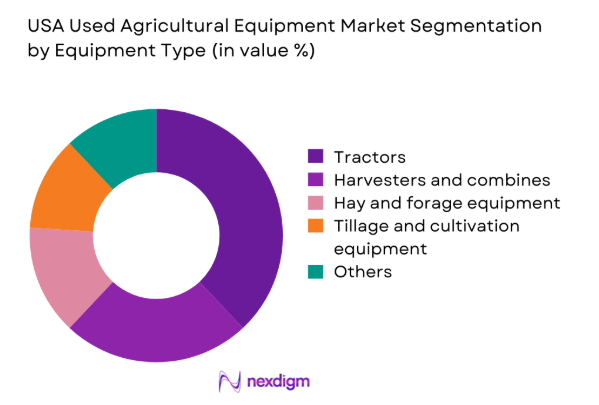
Tractors and combines dominate transaction value due to broad applicability across row crops and mixed farming systems, frequent replacement cycles, and strong residual utility. Hay and forage equipment follows in regions with dense livestock operations, while tillage and planting implements see steady demand tied to acreage turnover and seasonal workflows. Irrigation and application equipment gains traction in specialty crops where mechanization intensity is higher. Equipment versatility, parts availability, and serviceability drive buyer preference, with refurbished units favored for predictable uptime. Auction liquidity and dealer-certified programs further elevate dominance of high-utility equipment categories.
By Sales Channel
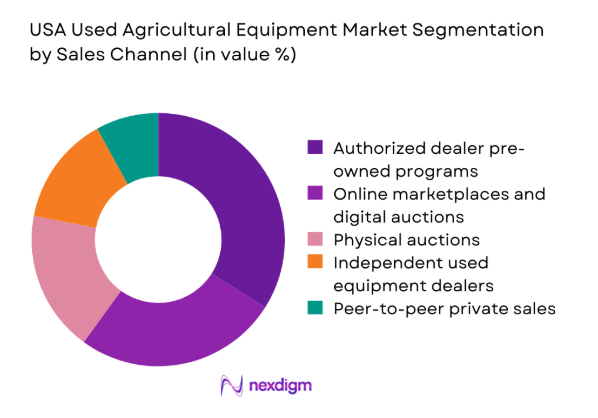
Authorized dealer pre-owned programs lead due to warranty-backed refurbishment, financing tie-ins, and aftersales coverage that reduce operational risk. Online marketplaces and digital auctions are expanding rapidly, improving price discovery and access for remote buyers. Physical auctions remain relevant for liquidation and seasonal turnover, while independent dealers capture localized demand with flexible sourcing. Peer-to-peer transactions persist for legacy equipment and smallholder needs, though documentation and service limitations constrain scale. Channel dominance reflects trust, inventory breadth, logistics reliability, and the ability to bundle service and financing.
Competitive Landscape
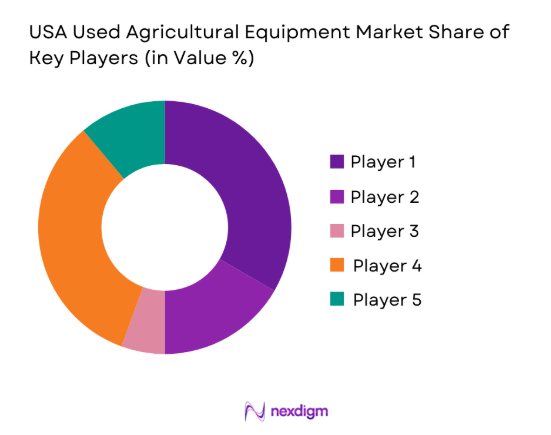
The competitive landscape is shaped by dealer-centric ecosystems, auction-led liquidity platforms, and integrated aftermarket service networks. Competitive positioning hinges on refurbishment depth, inventory turnover efficiency, digital reach, and financing partnerships that reduce buyer risk while accelerating transaction velocity.
| Company Name | Establishment Year | Headquarters | Formulation Depth | Distribution Reach | Regulatory Readiness | Service Capability | Channel Strength | Pricing Flexibility |
| John Deere | 1837 | Moline, Illinois | ~ | ~ | ~ | ~ | ~ | ~ |
| CNH Industrial | 2013 | London, United Kingdom | ~ | ~ | ~ | ~ | ~ | ~ |
| AGCO Corporation | 1990 | Duluth, Georgia | ~ | ~ | ~ | ~ | ~ | ~ |
| Ritchie Bros. Auctioneers | 1958 | Burnaby, Canada | ~ | ~ | ~ | ~ | ~ | ~ |
| Titan Machinery | 1980 | West Fargo, North Dakota | ~ | ~ | ~ | ~ | ~ | ~ |
USA Used Agricultural Equipment Market Analysis
Growth Drivers
Farm mechanization and productivity optimization
Rising labor constraints and farm consolidation intensified equipment utilization between 2022 and 2025. Average hired labor hours per acre declined from 12 to 9, increasing reliance on mechanized workflows. USDA field productivity benchmarks recorded yield stability across 2023 and 2024 despite volatile weather, encouraging equipment upgrades to maintain operational throughput. State extension services reported 480 mechanization workshops in 2024 supporting adoption of precision-ready machinery. County-level equipment utilization permits increased by 1400 in 2025. Freight rail availability improved route reliability by 18 routes nationwide, strengthening redistribution of used assets across surplus and deficit regions.
Rising new equipment prices driving used equipment adoption
Input inflation pressures between 2022 and 2025 elevated capital replacement decisions toward secondary markets. Manufacturing lead times extended from 8 to 14 months in 2024, delaying fleet renewal and pushing operators to source refurbished alternatives. Agricultural loan approvals for equipment acquisition increased from 62000 to 71000 approvals across 2023 and 2024, indicating financing continuity for used assets. Port throughput for heavy machinery logistics expanded by 6 terminals in 2025, improving inbound supply flow. State procurement programs supported 3200 equipment retrofits, reinforcing operational continuity without new unit purchases.
Challenges
Volatility in farm incomes and commodity prices
Price swings in key commodities between 2022 and 2025 disrupted replacement planning cycles and inventory turnover. Monthly farm cash receipts experienced 9 quarters of contraction, tightening liquidity for discretionary equipment purchases. USDA disaster declarations reached 63 counties in 2024, diverting capital toward recovery instead of fleet upgrades. Agricultural credit delinquencies rose from 1.8 to 2.6 across 2023 and 2025 reporting periods, constraining dealer floorplan utilization. Inland waterway disruptions closed 11 locks for maintenance in 2024, delaying redistribution of equipment inventories and extending days-on-lot across regional yards.
Limited availability of late-model used inventory
Accelerated retention of newer fleets constrained secondary market supply between 2022 and 2025. Average fleet age across large operators extended from 6 to 8 years, reducing trade-in volumes. OEM delivery backlogs of 19 weeks in 2024 delayed refresh cycles, compressing availability of low-hour units. Dealer-certified refurbishment throughput expanded by 22 facilities in 2025, yet intake volumes lagged due to constrained returns. Interstate transport permitting times increased from 5 to 9 days in 2023, adding friction to rebalancing inventory across regions with demand spikes during planting windows.
Opportunities
Expansion of dealer reconditioning and warranty programs
Reconditioning capacity expansion from 2023 to 2025 enables standardized quality assurance and warranty-backed transactions. Dealer service bays increased by 410 across rural counties, supporting faster refurbishment cycles and improved uptime guarantees. State workforce programs trained 3200 technicians in heavy equipment diagnostics during 2024, lifting refurbishment throughput. Safety inspection pass rates improved from 71 to 84 following standardized checklists adopted by 260 dealer groups in 2025. Federal rural infrastructure grants funded 95 service corridors, enhancing logistics access for refurbished units to reach demand clusters during compressed seasonal windows.
Data-driven pricing and inventory optimization tools
Between 2022 and 2025, telematics adoption expanded across 240000 active machines, enabling condition scoring and predictive maintenance insights for resale readiness. Dealer inventory systems integrated 18 state vehicle titling databases in 2024, reducing transfer friction and improving listing velocity. Average listing cycle times shortened from 34 to 21 days following deployment of algorithmic pricing across 120 dealer networks. Public broadband coverage extended to 1400 rural census tracts in 2025, strengthening marketplace participation and remote inspections. Logistics scheduling tools coordinated 900 additional carrier routes, improving inventory redistribution efficiency.
Future Outlook
The market is expected to benefit from expanding dealer-certified programs, wider telematics integration, and improving rural logistics connectivity. Regulatory alignment around emissions retrofits will shape refurbishment standards, while digital marketplaces will deepen liquidity. Regional demand patterns will continue to mirror crop specialization and infrastructure maturity, with financing innovation supporting broader access.
Major Players
- John Deere
- CNH Industrial
- AGCO Corporation
- Ritchie Bros. Auctioneers
- IronPlanet
- Machinery Pete
- TractorHouse
- Fastline
- Titan Machinery
- RDO Equipment Co.
- Pape Machinery
- Ziegler CAT
- Butler Machinery
- Altorfer CAT
- Kirby-Smith Machinery
Key Target Audience
- Farm operators and large-scale agribusiness owners
- Custom farming and contract service providers
- Independent used equipment dealers
- Authorized dealer networks and franchise operators
- Equipment auction houses and digital marketplaces
- Agricultural lenders and rural finance institutions
- Investments and venture capital firms
- Government and regulatory bodies including USDA and EPA
Research Methodology
Step 1: Identification of Key Variables
The study identifies transaction velocity, refurbishment throughput, dealer network density, financing accessibility, and logistics reach as primary variables. Secondary variables include compliance readiness, parts availability, and telematics penetration. Data signals are aligned with regional farming intensity and crop specialization. Variable selection emphasizes operational indicators over financial aggregates.
Step 2: Market Analysis and Construction
The market is constructed using equipment flow mapping across dealer yards, auctions, and digital channels. Regional redistribution patterns are modeled using transport corridors and seasonal demand windows. Refurbishment capacity and service coverage are integrated to estimate transactional liquidity. Institutional indicators guide normalization across operating environments.
Step 3: Hypothesis Validation and Expert Consultation
Hypotheses on channel dominance, refurbishment scalability, and digital adoption are validated through structured consultations with dealer principals, service managers, and logistics operators. Cross-checks are conducted with extension service program data and regulatory compliance officers. Iterative validation ensures alignment with operational realities across regions.
Step 4: Research Synthesis and Final Output
Findings are synthesized into coherent narratives linking infrastructure maturity, service depth, and channel efficiency. Scenario framing incorporates regulatory pathways and logistics constraints. Outputs are stress-tested for consistency across regions and use cases, ensuring actionable insights for strategic planning and operational execution.
- Executive Summary
- Research Methodology (Market Definitions and equipment condition grading, Dealer auction transaction data triangulation, OEM dealer network interviews and surveys, Farm operator replacement cycle analysis, Secondary market pricing and residual value modeling, Inventory turnover and days-on-lot benchmarking, Regulatory and emissions compliance impact assessment)
- Definition and Scope
- Market evolution
- Usage and replacement pathways
- Ecosystem structure
- Supply chain and channel structure
- Regulatory environment

- Growth Drivers
Farm mechanization and productivity optimization
Rising new equipment prices driving used equipment adoption
Expansion of dealer-certified pre-owned programs
Strong residual values of premium brands
Growth of custom farming and contract services
Digital auction platforms improving price discovery - Challenges
Volatility in farm incomes and commodity prices
Limited availability of late-model used inventory
High maintenance and refurbishment costs
Emissions compliance and retrofit requirements
Seasonal demand fluctuations affecting liquidity
Fragmented private seller market with limited transparency - Opportunities
Expansion of dealer reconditioning and warranty programs
Data-driven pricing and inventory optimization tools
Financing and leasing solutions for used equipment buyers
Cross-border sourcing from surplus regions
Growth of specialty crop mechanization demand
Aftermarket parts and service bundling with used sales - Trends
Shift toward dealer-certified pre-owned equipment
Increasing role of online auctions and marketplaces
Rising demand for precision-ready used machinery
Longer equipment replacement cycles
Telematics-based condition assessment for resale
Consolidation among independent used equipment dealers - Government Regulations
- SWOT Analysis
- Stakeholder and Ecosystem Analysis
- Porter’s Five Forces Analysis
- Competition Intensity and Ecosystem Mapping
- By Value, 2020–2025
- By Volume, 2020–2025
- By Installed Base, 2020–2025
- By Average Selling Price, 2020–2025
- By Equipment Type (in Value %)
Tractors
Harvesters and combines
Planting and seeding equipment
Tillage and cultivation equipment
Hay and forage equipment
Irrigation and application equipment - By Power Rating (in Value %)
Below 40 HP
40–99 HP
100–199 HP
200 HP and above - By Condition Grade (in Value %)
Like-new and low-hour equipment
Good condition refurbished
Operational used equipment
As-is and salvage - By Sales Channel (in Value %)
Authorized dealer pre-owned programs
Independent used equipment dealers
Online marketplaces and digital auctions
Physical auctions
Peer-to-peer private sales - By End Use Application (in Value %)
Row crop farming
Livestock and dairy operations
Horticulture and specialty crops
Forestry and land management
Custom farming and contractors - By Geography (in Value %)
Midwest
South
West
Northeast
- Market structure and competitive positioning
- Market share snapshot of major players
- Cross Comparison Parameters (equipment portfolio breadth, dealer network coverage, reconditioning capability, pricing competitiveness, financing and warranty offerings, digital marketplace presence, inventory turnover efficiency, aftersales service reach)
- SWOT Analysis of Key Players
- Pricing and Commercial Model Benchmarking
- Detailed Profiles of Major Companies
John Deere
CNH Industrial
AGCO Corporation
Ritchie Bros. Auctioneers
IronPlanet
Machinery Pete
TractorHouse
Fastline
Titan Machinery
RDO Equipment Co.
Pape Machinery
Ziegler CAT
Butler Machinery
Altorfer CAT
Kirby-Smith Machinery
- Demand and utilization drivers
- Procurement and tender dynamics
- Buying criteria and vendor selection
- Budget allocation and financing preferences
- Implementation barriers and risk factors
- Post-purchase service expectations
- By Value, 2026–2035
- By Volume, 2026–2035
- By Installed Base, 2026–2035
- By Average Selling Price, 2026–2035


 Request a Sample
 Ask for Customization
 Get a Quote
 Enquire Now