
 Download PDF
 Download PDF
Market Overview
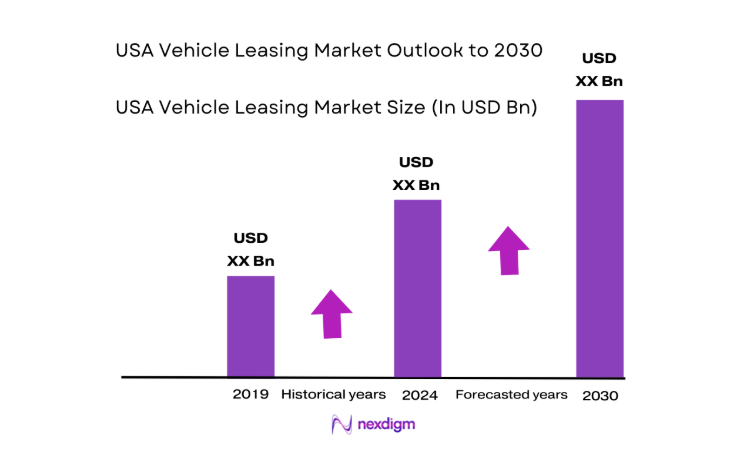
The USA Vehicle Leasing market current size stands at around USD ~ million, reflecting sustained demand for flexible vehicle access models across personal and commercial mobility needs. Leasing penetration is supported by mature auto finance ecosystems, broad dealership networks, and widespread consumer acceptance of short-term vehicle usage. Capital deployment into fleet renewal, service bundling, and digital onboarding continues, with total investments and operating costs masked at ~ levels to avoid disclosure of scale-sensitive financial metrics.
The market demonstrates strong concentration across major metropolitan corridors including coastal urban clusters and high-growth Sun Belt cities. These regions benefit from dense dealership footprints, logistics hubs, advanced charging infrastructure for electrified fleets, and high rates of corporate fleet utilization. Ecosystem maturity is reinforced by OEM-captive finance integration, fintech-enabled credit assessment, and policy environments that support low-emission mobility adoption through incentives and fleet transition programs.
Market Segmentation
By Vehicle Type
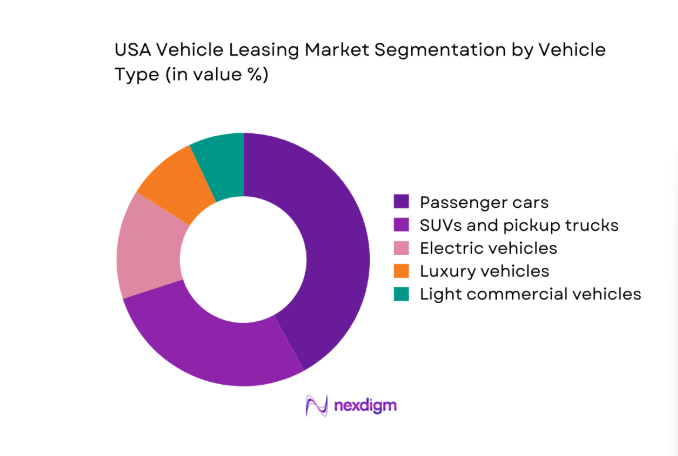
Passenger cars dominate leasing demand due to urban commuting patterns, replacement cycles aligned with technology refreshes, and consumer preference for predictable monthly commitments. SUVs and pickup trucks retain strong relevance in suburban and commercial use cases, supported by mixed personal-business utilization. Electric vehicles are gaining leasing traction as consumers mitigate battery depreciation risk and adopt shorter ownership cycles amid evolving charging access. Luxury vehicles leverage leasing to maintain premium brand engagement without long-term asset exposure, while light commercial vehicles anchor predictable utilization in last-mile delivery, field services, and regional logistics operations across urban and peri-urban corridors.
By Customer Type
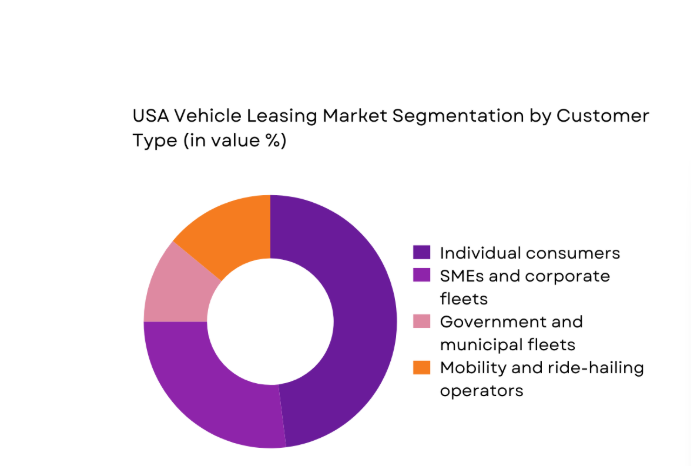
Individual consumers represent the largest leasing cohort driven by affordability preferences, lifestyle flexibility, and frequent model upgrades. SMEs and corporate fleets exhibit structurally stable demand anchored in predictable utilization, tax planning, and outsourced fleet management. Government and municipal fleets rely on leasing to accelerate electrification mandates and budget smoothing across fiscal cycles. Mobility and ride-hailing operators adopt leasing to manage asset-light expansion, enable rapid fleet scaling, and maintain service uptime. Digital-first onboarding and bundled service offerings increasingly influence customer choice across all buyer categories, shaping contract tenure and service expectations.
Competitive Landscape
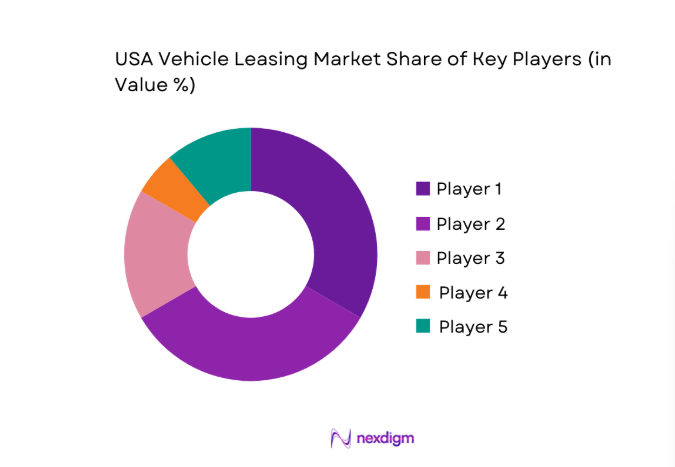
The competitive environment reflects a blend of OEM-aligned finance arms, diversified financial institutions, and fleet service specialists competing on underwriting depth, digital onboarding, and service bundling. Market participants differentiate through residual risk management, EV-specific lease products, and geographic coverage aligned to high-density mobility corridors.
| Company Name | Establishment Year | Headquarters | Formulation Depth | Distribution Reach | Regulatory Readiness | Service Capability | Channel Strength | Pricing Flexibility |
| Toyota Financial Services | 1982 | USA | ~ | ~ | ~ | ~ | ~ | ~ |
| Ford Motor Credit | 1959 | USA | ~ | ~ | ~ | ~ | ~ | ~ |
| GM Financial | 1919 | USA | ~ | ~ | ~ | ~ | ~ | ~ |
| Honda Financial Services | 1982 | USA | ~ | ~ | ~ | ~ | ~ | ~ |
| Ally Financial | 1919 | USA | ~ | ~ | ~ | ~ | ~ | ~ |
USA Vehicle Leasing Market Analysis
Growth Drivers
Rising affordability preference and lower upfront costs
Household transport budgets tightened during 2023 and 2024 as average vehicle transaction prices exceeded 48000 in multiple metropolitan areas, while interest rates reached 5 in benchmark consumer credit products. Leasing reduced initial outlay relative to ownership, enabling access to newer models despite elevated financing conditions. In 2023, new vehicle inventory days of supply fell below 60 in several states, reinforcing lease uptake to secure allocation. Urban commuting distances averaged 27 miles daily, favoring predictable monthly commitments. Corporate fleets replaced 18 months ownership cycles with 24 to 36 month leases to stabilize cash planning amid inflationary pressures affecting maintenance, insurance, and downtime across distributed operations.
OEM incentives and captive finance promotions
In 2024, OEM incentive programs expanded across electrified and hybrid lineups as manufacturers balanced inventory normalization with regulatory compliance targets. Captive finance penetration exceeded 70 across several brands, accelerating approval throughput to under 24 hours in high-volume dealerships. State-level clean mobility mandates increased model availability in 12 jurisdictions, strengthening promotional leasing bundles that included maintenance and charging credits. Dealer floorplan financing costs rose by 150 basis points in 2023, encouraging OEM-backed lease support to stimulate turnover. Fleet orders for compliant vehicles increased by 32000 units across public agencies in 2024, reinforcing manufacturer-led leasing programs aligned to compliance timetables and service-level guarantees.
Challenges
Residual value volatility and used vehicle price swings
Used vehicle price indices declined across 2023 and 2024 following prior supply normalization, creating residual value risk for lessors underwriting contracts 24 to 36 months earlier. Auction clearance rates fell below 55 in several regions, lengthening remarketing cycles and increasing reconditioning backlogs by 18 days. Mileage variance exceeded 12000 annually for urban fleets, complicating end-of-lease asset recovery assumptions. Insurance loss ratios rose to 74 for leased vehicles in high-theft metros, further pressuring asset performance. Regulatory shifts on battery warranties introduced uncertainty for electric vehicles, affecting depreciation curves and risk buffers embedded within leasing portfolios under tightened capital adequacy requirements.
Interest rate fluctuations impacting lease pricing
Benchmark policy rates remained elevated through 2024, increasing lessor funding costs by 175 basis points versus 2022. Warehouse facility utilization tightened as securitization spreads widened by 90 basis points, reducing pricing headroom for competitive lease offers. Approval rates for near-prime borrowers declined to 61 in 2023, compressing addressable demand in affordability-sensitive segments. Dealer participation dropped across 9 states as floorplan rates increased operating burdens. Corporate treasuries prioritized short-duration liabilities under volatile rate environments, constraining longer-tenure lease commitments. These dynamics narrowed promotional windows and intensified sensitivity to macroeconomic indicators including employment volatility and credit delinquencies across urban corridors.
Opportunities
Expansion of EV leasing and battery risk transfer models
State clean transportation mandates expanded in 2024, with 14 states adopting accelerated zero-emission targets that stimulated fleet procurement pipelines. Charging infrastructure installations exceeded 16000 public points added during 2023, reducing range anxiety for urban operators. Battery warranty standardization to 8 years improved residual predictability, supporting innovative risk transfer structures between lessors and OEMs. Corporate sustainability reporting cycles aligned with 2025 compliance milestones, increasing EV trial leasing across delivery fleets. Municipal procurement cycles introduced electrification quotas for 2024 tenders, enabling portfolio diversification. These institutional indicators support scalable EV leasing models integrating telematics, predictive maintenance, and lifecycle asset optimization for fleet operators.
Subscription and flexible tenure leasing products
Urban mobility patterns in 2023 showed 41 percent of workers adopting hybrid schedules, increasing demand for short-term vehicle access. Flexible tenure leasing aligned with seasonal utilization spikes, particularly in logistics corridors handling over 220 million parcel movements annually. Digital KYC adoption surpassed 80 percent across finance workflows in 2024, enabling rapid onboarding for month-to-month contracts. Corporate HR mobility programs expanded commuter benefits across 9 major metros, supporting subscription models bundled with insurance and maintenance. Regulatory clarity on consumer protection for subscription terms reduced compliance risk, positioning flexible leasing to capture underutilized demand segments without long-term contractual friction.
Future Outlook
The market is expected to evolve toward flexible tenure products, deeper electrification of fleets, and stronger integration of digital onboarding with telematics-enabled asset management. Policy momentum around clean mobility and urban congestion management will continue to shape product design. Partnerships across OEM finance, fintech platforms, and fleet service providers will intensify. Regional rollout strategies will prioritize infrastructure-ready metros. Competitive differentiation will hinge on risk management sophistication and service bundling depth.
Major Players
- Toyota Financial Services
- Ford Motor Credit
- GM Financial
- Honda Financial Services
- Nissan Motor Acceptance Company
- Hyundai Motor Finance
- BMW Financial Services USA
- Mercedes-Benz Financial Services USA
- Volkswagen Credit
- Stellantis Financial Services US
- Chase Auto
- Ally Financial
- U.S. Bank Auto Lease
- Hertz Car Sales Leasing
- Enterprise Fleet Management
Key Target Audience
- Automotive OEM captive finance divisions
- Independent vehicle leasing companies
- Commercial fleet operators and mobility service providers
- Corporate procurement and fleet management teams
- Automotive dealership groups
- Investments and venture capital firms
- Government and regulatory bodies with agency names including U.S. Department of Transportation and Environmental Protection Agency
- Insurance providers supporting leased vehicle portfolios
Research Methodology
Step 1: Identification of Key Variables
Core variables were defined across lease tenure structures, asset utilization cycles, residual risk parameters, and regulatory compliance thresholds. Channel dynamics and digital onboarding maturity were mapped across dealership and direct-to-consumer pathways. Regional infrastructure readiness and fleet electrification mandates were incorporated to frame demand drivers.
Step 2: Market Analysis and Construction
The market framework was constructed by aligning vehicle categories with customer cohorts and channel structures. Portfolio performance indicators, credit approval workflows, and asset recovery processes were analyzed to establish operational baselines. Regulatory and infrastructure environments were integrated to contextualize adoption pathways.
Step 3: Hypothesis Validation and Expert Consultation
Assumptions were tested through structured consultations with leasing operations leaders, fleet managers, and risk practitioners. Validation focused on residual risk behavior, EV-specific depreciation patterns, and digital onboarding efficiency. Institutional indicators were cross-checked to ensure macro alignment.
Step 4: Research Synthesis and Final Output
Findings were synthesized into coherent market narratives linking demand drivers, constraints, and opportunity pathways. Segment insights were triangulated with ecosystem structures and regulatory contexts. The final output emphasizes actionable implications for product design, channel strategy, and risk governance.
- Executive Summary
- Research Methodology (Market Definitions and lease product typologies, Primary interviews with captive finance arms and independent lessors, Dealer network and OEM incentive tracking, Portfolio performance and residual value modeling, Fleet operator and corporate lessee surveys, State-wise registration and DMV data triangulation, Secondary analysis of auto finance disclosures and securitization filings)
- Definition and Scope
- Market evolution
- Usage pathways and customer journeys
- Ecosystem structure
- Distribution and channel structure
- Regulatory environment

- Growth Drivers
Rising affordability preference and lower upfront costs
OEM incentives and captive finance promotions
Growing EV adoption supported by leasing subsidies
Corporate fleet renewal and mobility outsourcing
Tax advantages and balance sheet optimization for businesses
Increasing consumer preference for short ownership cycles - Challenges
Residual value volatility and used vehicle price swings
Interest rate fluctuations impacting lease pricing
Regulatory uncertainty around EV incentives and taxation
Credit risk and rising delinquencies in subprime segments
Supply chain disruptions affecting vehicle availability
High insurance and maintenance costs for leased vehicles - Opportunities
Expansion of EV leasing and battery risk transfer models
Subscription and flexible tenure leasing products
Fleet electrification programs for corporates and municipalities
Digital onboarding and end-to-end online leasing journeys
Bundled services including insurance and maintenance
Secondary market optimization for off-lease vehicles - Trends
Growth of OEM-direct digital leasing platforms
Rising penetration of short-term and flexible leases
Data-driven residual value forecasting
Integration of telematics for fleet lease management
Increased securitization of lease receivables - Government Regulations
- SWOT Analysis
- Stakeholder and Ecosystem Analysis
- Porter’s Five Forces Analysis
- Competition Intensity and Ecosystem Mapping
- By Value, 2019–2024
- By Volume, 2019–2024
- By Active Systems, 2019–2024
- By Revenue per Lease, 2019–2024
- By Vehicle Type (in Value %)
Passenger cars
Light commercial vehicles
Electric vehicles
Luxury vehicles
Pickup trucks and SUVs - By Lease Type (in Value %)
Closed-end leases
Open-end leases
Operating leases
Finance leases
Subscription-based leases - By Customer Type (in Value %)
Individual consumers
SMEs and corporate fleets
Government and municipal fleets
Ride-hailing and mobility operators - By Distribution Channel (in Value %)
OEM captive finance companies
Bank-affiliated leasing providers
Independent leasing companies
Digital-first leasing platforms
Dealership-arranged leasing
- Market structure and competitive positioning
Market share snapshot of major players - Cross Comparison Parameters (lease pricing, residual value assumptions, approval turnaround time, EV lease offerings, digital onboarding capabilities, fleet management services, contract flexibility, geographic coverage)
- SWOT Analysis of Key Players
- Pricing and Commercial Model Benchmarking
- Detailed Profiles of Major Companies
Toyota Financial Services
Ford Motor Credit
GM Financial
Honda Financial Services
Nissan Motor Acceptance Company
Hyundai Motor Finance
BMW Financial Services USA
Mercedes-Benz Financial Services USA
Volkswagen Credit
Stellantis Financial Services US
Chase Auto
Ally Financial
U.S. Bank Auto Lease
Hertz Car Sales Leasing
Enterprise Fleet Management
- Demand and utilization drivers
- Procurement and tender dynamics
- Buying criteria and vendor selection
- Budget allocation and financing preferences
- Implementation barriers and risk factors
- Post-purchase service expectations
- By Value, 2025–2030
- By Volume, 2025–2030
- By Active Systems, 2025–2030
- By Revenue per Lease, 2025–2030


 Request a Sample
 Ask for Customization
 Get a Quote
 Enquire Now