
 Download PDF
 Download PDF
Market Overview
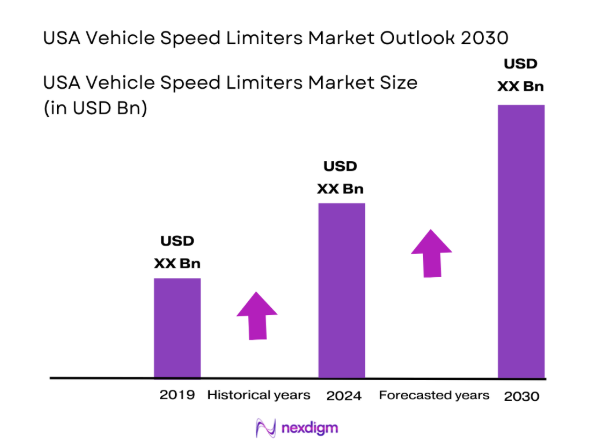
The USA vehicle speed limiters market is valued at USD ~ billion in 2024, with strong growth driven by government regulations and the increasing demand for fleet safety and operational efficiency. The market is primarily driven by the need for regulatory compliance, especially in the commercial vehicle sector, where speed limiters are becoming mandatory to reduce road accidents and fatalities. The adoption of telematics systems integrated with speed limiters further accelerates market growth, as companies seek to monitor driver behavior and enhance vehicle performance. Additionally, rising concerns about fuel efficiency and insurance premiums, alongside technological advancements in speed limiter systems, contribute to the market’s expansion.
The USA dominates the vehicle speed limiters market due to stringent regulations enforced by bodies such as the Federal Motor Carrier Safety Administration (FMCSA) and the National Highway Traffic Safety Administration (NHTSA). Cities with dense traffic and high commercial vehicle activity, such as Los Angeles, New York, and Chicago, are key hubs for speed limiter adoption. These cities lead due to their regulatory frameworks, the prevalence of fleet operators, and the adoption of safety technologies. The widespread use of telematics and fleet management solutions further reinforces the USA’s dominance in this sector, making it a central player in the global market.
Market Segmentation
By Product Type
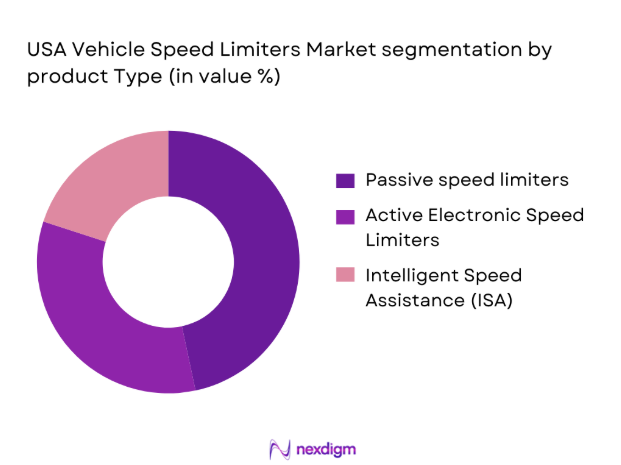
The USA vehicle speed limiters market is segmented by product type into passive speed limiters, active electronic speed limiters, and intelligent speed assistance (ISA) systems. Among these, the active electronic speed limiters hold a dominant share in the market. This is due to their increased accuracy, integration with telematics, and compliance with advanced vehicle safety standards. Active limiters allow real-time monitoring and adjustments to vehicle speed, making them ideal for both commercial fleets and passenger vehicles. Furthermore, advancements in AI-based systems and telematics integration have further boosted the adoption of active electronic speed limiters. These features make active limiters more appealing for fleet management, leading to their strong market presence in 2024.
By Vehicle Type
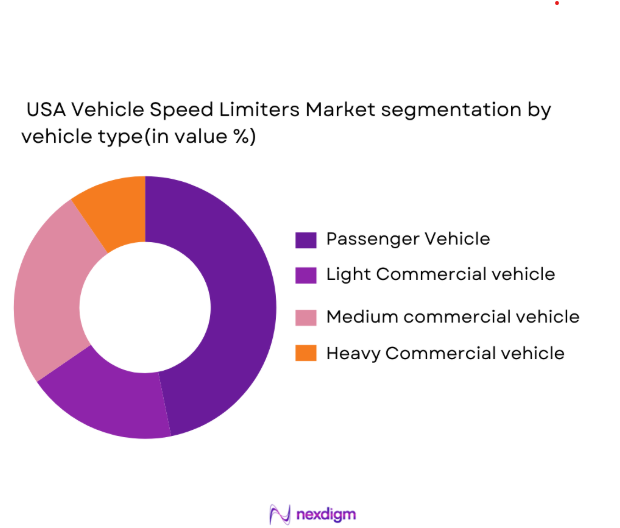
The vehicle category segment includes passenger vehicles, light commercial vehicles, medium commercial vehicles, and heavy commercial vehicles. The heavy commercial vehicles segment dominates the market due to the stricter regulations for commercial vehicle safety and speed control. Large fleets of trucks and buses are subject to regulatory mandates, making them a key driver of the adoption of speed limiters. In particular, trucking and freight operations are increasingly adopting speed limiters to comply with safety regulations and to reduce accidents. As the fleet size continues to grow in the USA, the demand for speed limiters in the heavy commercial vehicles segment is expected to remain the highest.
Competitive Landscape
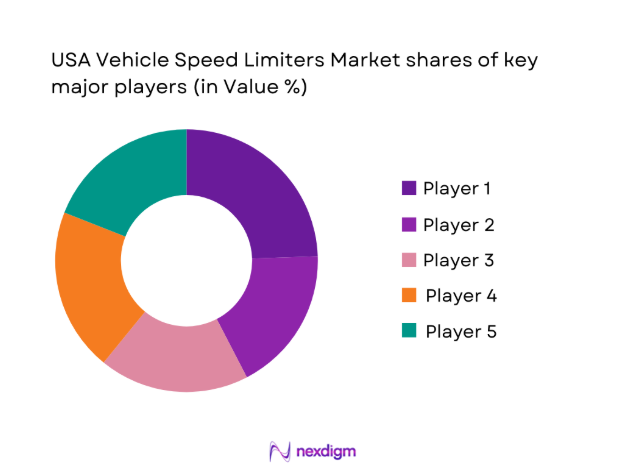
The USA vehicle speed limiters market is dominated by a few major players, including global companies such as ZF Friedrichshafen, Continental AG, and Wabco. These companies are key players due to their technological advancements, strong product portfolios, and extensive market presence across OEMs and fleet operators. The market is also seeing significant competition from emerging players in telematics and AI integration. This consolidation highlights the influence of established players but also reflects the growing importance of innovation in driving future growth.
| Company Name | Establishment Year | Headquarters | Revenue | Product Portfolio | Technology Integration | Regulatory Compliance |
| ZF Friedrichshafen | 1915 | Germany | – | – | – | – |
| Continental AG | 1871 | Germany | –
|
–
|
–
|
– |
| Wabco Holdings | 1869 | USA | –
|
–
|
–
|
–
|
| Aptiv PLC | 1994 | Ireland | –
|
–
|
–
|
–
|
| Geotab | 2000 | Canada | –
|
–
|
–
|
–
|
USA Vehicle Speed Limiters Market Analysis
Growth Drivers
Fleet Safety Economics
Fleet safety economics has significantly influenced the adoption of vehicle speed limiters in the USA, particularly with an emphasis on reducing accidents, fatalities, and related insurance costs. According to the National Highway Traffic Safety Administration (NHTSA), traffic accidents in the USA cost the economy more than $400 billion annually, accounting for the loss of productivity, legal costs, and medical expenses. With the increasing costs of accidents, fleet operators are increasingly investing in speed limiter technology to ensure safer road practices. Additionally, insurance providers are offering reduced premiums to fleets that implement speed limiters due to the demonstrated reduction in risk. The implementation of speed limiters is also part of broader corporate social responsibility efforts to reduce environmental impacts and enhance road safety.
Insurance Premium Optimization
Insurance premium optimization is becoming a key factor in the adoption of vehicle speed limiters. According to a report by the Insurance Institute for Highway Safety (IIHS), the implementation of safety technologies, including speed limiters, can result in reduced accident claims, thus helping businesses optimize their insurance premiums. In the USA, where commercial fleet operations are substantial, the average insurance premiums for fleets have increased by 3-5% annually in recent years. Speed limiters reduce vehicle speed during high-risk driving situations, contributing to fewer accidents and claims. This economic incentive is helping accelerate the adoption of speed limiters across various fleet types, driving down overall fleet insurance costs. These reductions are appealing to both large logistics firms and small fleet operators.
Market Challenges
Driver Acceptance
A significant challenge to the widespread adoption of vehicle speed limiters in the USA is driver acceptance. Many drivers, particularly those in commercial fleet operations, resist speed limiters as they feel it restricts their ability to control vehicle speed based on road conditions. Additionally, some drivers believe speed limiters could lead to inefficiencies in reaching delivery targets or hinder performance during critical driving situations. According to a 2023 survey by the American Trucking Association (ATA), nearly 40% of truck drivers expressed concerns over the restriction of their driving autonomy due to speed limiters. This resistance affects the overall rate of adoption of speed limiters, despite the clear economic and safety benefits.
Retrofit Complexity
Another challenge facing the USA vehicle speed limiters market is retrofit complexity. Installing speed limiters in existing fleets is often more difficult than in new vehicles, especially when older vehicles lack the necessary telematics or vehicle control systems. The cost and time required to retrofit these vehicles with the latest speed limiter technology can be substantial, particularly for small and medium-sized fleet operators. According to a 2023 study by the US Department of Transportation (USDOT), retrofitting older vehicles often requires substantial upgrades to vehicle systems, resulting in additional maintenance costs and operational downtime for fleet operators. This retrofit complexity presents a barrier to the adoption of speed limiters across the entire commercial vehicle sector.
Opportunities
Connected Fleets
The increasing integration of telematics and Internet of Things (IoT) devices into commercial fleets offers a significant opportunity for the vehicle speed limiters market in the USA. Connected fleets allow for real-time monitoring of vehicles and driver behavior, providing fleet managers with valuable data to enhance safety and optimize operations. According to the US Department of Transportation, over 50% of commercial fleets in the USA now use connected fleet solutions. This data-driven approach allows fleet operators to better enforce speed regulations, monitor fuel efficiency, and enhance safety, providing a strong growth opportunity for speed limiter technology. As fleet management systems become more connected, the demand for integrated speed limiter solutions that work in tandem with telematics systems is expected to grow.
Usage-Based Insurance
Usage-based insurance (UBI) is another emerging opportunity for the vehicle speed limiters market. UBI programs, which charge fleet operators based on their actual vehicle usage and driving behavior, are gaining popularity in the USA. According to a 2022 report by the National Association of Insurance Commissioners (NAIC), UBI adoption among commercial fleets in the USA has increased by 10% in recent years. As insurers increasingly tie premiums to driver behavior, such as speed, the integration of speed limiters in vehicles becomes a key factor in reducing premium costs. Fleet operators who use speed limiters can provide data to insurers proving safer driving behavior, resulting in lower premiums and further driving adoption of speed limiter systems.
Future Outlook
The USA vehicle speed limiters market is expected to grow significantly over the next five years, with increasing government regulations, advancements in telematics, and a focus on reducing road accidents. These factors will drive the demand for speed limiter systems, especially in the commercial vehicle segment. As fleet operators seek to comply with safety regulations and optimize fleet performance, the market is likely to experience sustained growth. Additionally, as telematics and AI technology become more integrated with vehicle systems, the functionality and efficiency of speed limiters will continue to improve, further stimulating market demand.
Major Players
- ZF Friedrichshafen
- Continental AG
- Wabco Holdings
- Aptiv PLC
- Geotab
- Bosch Mobility Solutions
- Dana Incorporated
- BorgWarner Inc.
- Trimble Transportation
- Omnitracs
- Geotab
- MiX Telematics
- Lytx Inc.
- Samsara Inc.
- Teletrac Navman
Key Target Audience
- Fleet Operators
- Automotive OEMs
- Telematics Solution Providers
- Insurance Providers
- Government Agencies
- Regulatory Bodies
- Fleet Management Technology Vendors
- Investment and Venture Capitalist Firms
Research Methodology
Step 1: Identification of Key Variables
This phase involves constructing an ecosystem map of all stakeholders in the USA Vehicle Speed Limiters Market. Desk research, using secondary and proprietary data sources, is used to identify key market drivers, technological trends, and regulatory influences. The main objective is to define the critical variables shaping the market landscape.
Step 2: Market Analysis and Construction
In this phase, historical data is compiled and analyzed to assess the USA vehicle speed limiters’ market growth trajectory. This includes evaluating key market metrics such as penetration rates, revenue generation, and adoption of telematics. The data gathered helps build a reliable forecasting model for the future market outlook.
Step 3: Hypothesis Validation and Expert Consultation
Hypotheses regarding market growth and trends are validated through expert consultations. Industry leaders from fleet management, regulatory bodies, and OEMs are interviewed to gather operational and market data. This ensures the accuracy of assumptions and provides deeper insights into current market practices.
Step 4: Research Synthesis and Final Output
The final phase involves synthesizing all collected data and confirming its accuracy through interactions with leading vehicle manufacturers and fleet managers. This process ensures a comprehensive, accurate, and validated report that provides actionable insights and strategies for market participants.
- Executive Summary
- Research Methodology (Market Definitions and Assumptions, USA Regulatory Boundary Conditions, Abbreviations, Market Engineering Logic, Bottom-Up OEM & Fleet Data Modeling, Top-Down Policy-Driven Adoption Modeling, Primary Interviews with Fleet Safety Heads & OEM Engineers, Data Triangulation Framework, Sensitivity & Risk Modeling)
- Definition and Scope
- Market Genesis and Evolution in the USA
- Technology Adoption Curve and Maturity Mapping
- USA Automotive & Commercial Vehicle Business Cycle Alignment
- Speed Limiter Ecosystem & Value Chain Analysis

- Growth Drivers
Fleet Safety Economics
Insurance Premium Optimization
Federal & State Safety Mandates - Market challenges
Driver Acceptance
Retrofit Complexity
Legacy Vehicle Compatibility - Opportunities
Connected Fleets
Usage-Based Insurance
Smart City Integration - Technology & Business Trends
ISA Mandates
AI-Based Speed Governance
V2X Integration - Regulatory & Compliance Landscape
FMCSA Rules
NHTSA Guidelines
State-Level Variability - Risk Assessment & Impact Analysis
Regulatory Delays
OEM Resistance
Cybersecurity Exposure - SWOT Analysis
- Stakeholder & Influence Mapping
- Porter’s Five Forces Analysis
- Competitive Intensity & Market Concentration Index
- Market Size by Value 2019-2025
- Market Size by Volume 2019-2025
- Market Size by Average Selling Price 2019-2025
- By Product Architecture (In Value%)
Passive Speed Limiters
Active Electronic Speed Limiters
Intelligent Speed Assistance (ISA) Systems
Telematics-Integrated Speed Limiters
ADAS-Linked Speed Control Modules - By Vehicle Category (In Value%)
Passenger Vehicles
Light Commercial Vehicles
Medium Commercial Vehicles
Heavy Commercial Vehicles
Specialty & Off-Highway Vehicles - By Technology Interface (In Value%)
CAN-Bus Integrated
OBD-Based
ECU Embedded
GPS-Linked Dynamic Limiters
Cloud-Connected OTA-Enabled Systems - By Fitment Type (In Value%)
Factory-Installed (OEM Level)
Dealer-Installed
Aftermarket Retrofit - By End-Use Industry (In Value%)
Logistics & Freight Fleets
Public Transportation & School Buses
Construction & Mining Fleets
Government & Municipal Fleets
Corporate & Rental Fleets
- Market Share Analysis (Value Share, Installed Base Share, OEM Penetration Rate)
- Cross-Comparison Parameters (OEM Partnerships, Technology Stack Depth, Software Update Capability, Regulatory Certifications, Fleet Analytics Integration, Geographic Coverage, Pricing Model, Cybersecurity Readiness)
- Competitive Positioning Matrix (Innovation vs Scale, OEM vs Aftermarket Strength)
- Pricing & Margin Benchmarking (Hardware ASP, Software Subscription, Bundled Telematics Pricing)
- Fleet Demand Drivers & Utilization Patterns (Miles Driven, Duty Cycle Severity)
- Procurement Economics (CAPEX vs OPEX Preference, TCO Impact)
- Compliance-Driven vs Voluntary Adoption Analysis
- Pain Point & Risk Exposure Mapping (Accidents, Litigation, Fuel Inefficiency)
- Decision-Making Framework (Fleet Owner vs Safety Officer vs Insurer Influence)
- Future Market Size by Value, 2026-2030
- Future Market Size by Volume, 2026-2030
- Future Market Size by Average Price, 2026-2030


 Request a Sample
 Ask for Customization
 Get a Quote
 Enquire Now