
 Download PDF
 Download PDF
Market Overview
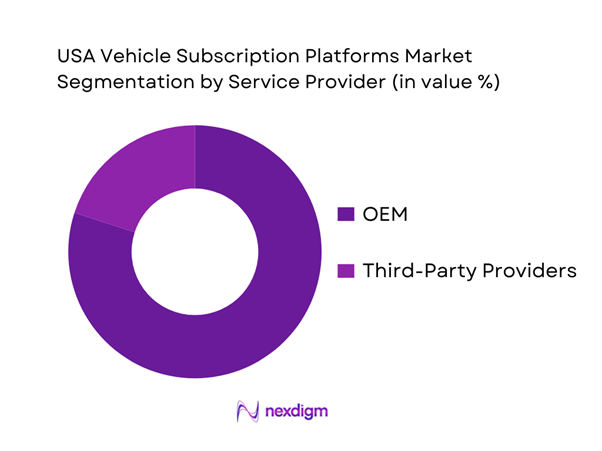
The USA Vehicle Subscription Platforms Market generated USD ~ million in revenue in the latest year, with projecting it to reach USD ~ million by the end of the forecast window. This expansion is being driven by the “all-in-one” subscription promise (vehicle access bundled with servicing, assistance, and platform-led digital onboarding), plus OEM-led captive programs that can price, underwrite risk, and manage residual values at scale—reflected in OEMs’ ~ revenue share in the latest year.
In the prior year, the USA market was cited at USD ~ million, underscoring how reported values can vary by definition (e.g., “vehicle subscription” vs broader “subscription services,” coverage scope, and inclusions). Operationally, the market is dominated by large urban corridors—Los Angeles, New York metro, San Francisco Bay Area, Miami, Chicago, Dallas–Fort Worth, Seattle, and Atlanta—because these regions concentrate high-income demand, dense mobility needs, premium-vehicle affinity, and faster go-to-market via dealership networks, concierge logistics, and insurer partnerships that reduce friction for monthly subscribers.

Market Segmentation
By Service Provider
The USA Vehicle Subscription Platforms Market is segmented by service provider into OEM (captive/OEM-led programs) and Third-Party Providers. In the USA, OEM-led subscriptions dominate because manufacturers can blend subscription into the broader ownership funnel (trial → lease/finance conversion), control fleet sourcing, and run standardized service and warranty pathways through authorized dealer/service ecosystems. This also improves unit economics through better residual-value governance and remarketing channels. In practice, OEM programs win where brand strength and reliability expectations matter most (premium, near-luxury, and “upgrade ladder” customers), while third-party providers compete by expanding multi-brand choice, simplifying onboarding, and offering flexible approval models.
By Subscription Type
The market is also commonly segmented into Multi-Brand Subscription and Single-Brand Subscription. Multi-brand subscription models tend to lead where customers want “vehicle variety” (switching between body styles for life events, seasonality, or commute patterns), and where platform economics (aggregated demand + pooled fleet utilization) improve conversion and retention. Single-brand programs remain powerful in premium use-cases because they deliver consistent service standards and reinforce brand loyalty; they also integrate more naturally with OEM captive finance and dealer service operations.

Competitive Landscape
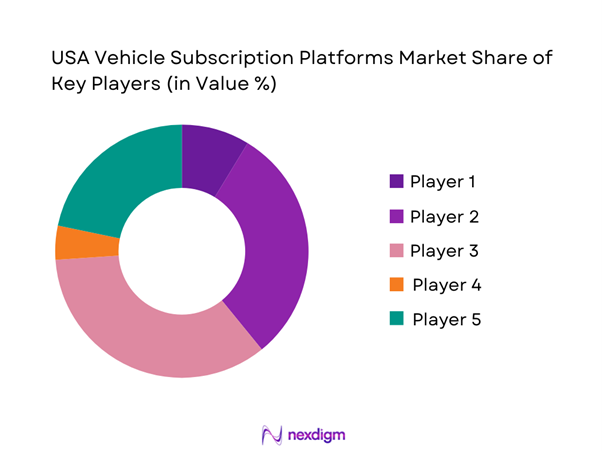
The USA Vehicle Subscription Platforms Market is moderately concentrated, with OEM-led subscription programs setting service expectations (bundled convenience, standardized maintenance pathways) and a second layer of mobility providers competing on flexibility, multi-brand choice, and digital-first onboarding. Luxury and near-luxury brands use subscriptions as a high-intent acquisition funnel, while multi-brand aggregators and flexible “month-to-month” players focus on utilization, logistics execution, and underwriting/insurance bundling partnerships to scale profitably.
| Company | Est. Year | HQ | Program Type | Minimum Term / Commitment | Vehicle Swap Policy | What’s Bundled | Core Go-to-Market | Coverage / Constraints |
| Care by Volvo | 1927 | Gothenburg, Sweden | ~ | ~ | ~ | ~ | ~ | ~ |
| Porsche Drive | 1931 | Stuttgart, Germany | ~ | ~ | ~ | ~ | ~ | ~ |
| SIXT+ | 1912 | Pullach, Germany | ~ | ~ | ~ | ~ | ~ | ~ |
| Flexcar | 2019 | Boston, USA | ~ | ~ | ~ | ~ | ~ | ~ |
| Autonomy | 2021 | USA | ~ | ~ | ~ | ~ | ~ | ~ |
USA Vehicle Subscription Platforms Market Analysis
Growth Drivers
Flexible mobility demand signals
U.S. vehicle-subscription platforms ride on a demand base shaped by a very large, still-expanding mobility economy rather than “one-time” ownership behavior. The U.S. economy is measured at USD ~ trillion and USD ~ per capita, supporting recurring-payment mobility adoption across affluent metros and multi-car households. On the usage side, Americans drove ~ billion vehicle-miles on roads and streets, which keeps “access + convenience” propositions relevant for commuters, gig workers, and households that want to swap vehicles by life-stage (moving, new job, new child) without a long-term commitment. Finally, after-tax capacity matters for subscriptions: U.S. disposable personal income is reported at USD ~ billion and USD ~ billion across consecutive recent years, reinforcing the addressable base for bundled, month-to-month mobility products positioned as predictable household outlays rather than asset ownership.
OEM inventory optimization levers
Subscription platforms increasingly matter to OEMs and captive finance arms because the U.S. new-vehicle market has returned to high-throughput volumes, making “controlled channels” for allocation, utilization, and remarketing operationally attractive. Total vehicle sales are recorded at ~ and ~ and ~ (annual sum of monthly SAAR observations, in “millions of units” terms as published) across recent years, underscoring that OEMs are managing large unit flows where channel mix can materially affect pipeline stability. Macro capacity supports this: the U.S. population is ~, which anchors a large driver base and dense metro demand where subscriptions can be deployed as “fleet-like” pools (short turn, standardized reconditioning, structured redeployment). The key OEM lever is not “selling more cars,” but smoothing distribution and utilization when retail rhythms shift—subscriptions can absorb units into service, then route them into certified used or auction lanes with known provenance. This becomes easier when households are still generating rising after-tax income totals (disposable personal income at USD ~ billion), creating a stable payer base for multi-vehicle access programs in top metros and employer corridors.
Challenges
Insurance loss ratios and premium reset risk
Insurance is a foundational dependency for vehicle subscriptions because platforms must keep vehicles continuously covered while cycling drivers, usage profiles, and geographies. Public safety context shows why insurers reprice risk: traffic fatalities are estimated at ~ in one year and reported at ~ in the prior year—large absolute numbers that keep claims severity salient in underwriting decisions even when fatality counts move down. The road-use base is also enormous: cumulative driving reaches ~ billion vehicle-miles, meaning exposure is structurally high and geographically diverse (weather, congestion, theft risk), complicating standardized subscription pricing and coverage design. From a macro lens, the U.S. economy at USD ~ trillion supports high vehicle utilization tied to commerce and commuting, but that same activity expands exposure events and claim frequency opportunities. The operational implication is that a subscription operator cannot treat insurance as a static add-on; it must build carrier partnerships, telematics-enabled risk screening, and rigorous driver eligibility rules so that policy resets do not break unit economics or force abrupt program pauses, especially in multi-state programs.
Residual value volatility
Residual outcomes matter more in subscriptions than in one-time retail because vehicles are monetized twice: first through monthly access, then through remarketing. Public statistics illustrate why volatility is an operating risk: the “Used Cars and Trucks” CPI series posts ~ at a recent monthly observation, and the series’ movement over time is a visible proxy for changing used-vehicle conditions that can shift remarketing proceeds. The scale of the pipeline intensifies sensitivity: total vehicle sales recorded at ~ indicates a very large flow that ultimately feeds the used market, so even modest shifts in the used-vehicle environment can move large absolute volumes and create “timing risk” for subscription fleet exits. The macro base—disposable personal income at USD ~ billion—supports ongoing used demand, but demand composition can swing between new and used depending on credit conditions and household budgets, which then feeds back into residual outcomes for fleets. For subscription operators, this means residual management becomes a core competency requiring disciplined fleet mix, proactive mileage and condition controls, and diversified exit channels.
Opportunities
EV access without ownership
Subscriptions can serve as an “EV trial + access” channel in a market where plug-in volumes are already large enough to support standardized fleet procurement, but where many households still prefer flexibility over long-term ownership commitment. A federal EV dashboard reports ~ plug-in electric vehicles sold year-to-date through a recent point, indicating substantial unit flow that can seed subscription fleets and improve availability in key metros. The macro base supports the premium add-on services EV subscriptions often require (charging support, education, concierge): the economy at USD ~ trillion and disposable personal income at USD ~ billion sustain payer ability for bundled mobility experiences, especially in top EV metros where customers value convenience. Operationally, this creates a forward-growth opportunity: subscriptions can reduce “EV adoption friction” by letting customers experience range and charging realities before making a long-term decision—while operators keep control of the asset and can redeploy EVs across customer cohorts as familiarity grows.
Bundled insurance and safety scoring
A high-impact opportunity is to combine subscription access with safety scoring (connected signals, driver coaching) and insurance alignment, because public road safety numbers remain large enough to keep carriers and regulators focused on risk reduction. Traffic fatalities are estimated at ~ in one year and ~ in a subsequent partial-year period, reinforcing that the safety problem remains material in absolute terms and that measurable improvement pathways are valuable. The connectivity substrate is in place: mobile internet connections number ~ and total fixed plus mobile connections reach ~, enabling continuous app engagement, coaching, and incident workflows as part of the subscription bundle. The macro base—U.S. GDP at USD ~ trillion—supports large-scale enterprise adoption of safety programs by employers, fleets, and insurers, creating partner routes for subscription platforms to distribute bundled offerings. In practical market terms, the opportunity is to turn subscriptions into “managed mobility” with smoother renewals, more predictable operations, and better risk segmentation.
Future Outlook
Over the next planning cycle, the USA Vehicle Subscription Platforms Market is expected to expand as OEMs operationalize subscriptions as a customer acquisition and retention channel, and as third-party platforms refine unit economics through better fleet utilization, improved underwriting and insurance packaging, and higher-velocity remarketing. Growth is likely to be strongest in metro markets where delivery and pick-up logistics are easiest to standardize, and where premium demand supports higher ARPU bundles. EV subscriptions should scale where charging access, predictable mileage packages, and lower maintenance complexity can be translated into clear consumer value without sacrificing residual performance.
Major Players
- Volvo
- Porsche
- SIXT
- Flexcar
- Autonomy
- FINN
- Free2move
- Mercedes-Benz
- Volkswagen
- BMW
- Audi
- Hertz
- Enterprise
- swapDrive
Key Target Audience
- OEM Strategy & Mobility Business Units
- Captive Finance & Mobility Product Teams
- Dealer Group Executives and Used-Vehicle Remarketing Heads
- Fleet Leasing, Fleet Management, and Corporate Mobility Heads
- Auto Insurance Carriers & Embedded-Insurance Product Leaders
- Platform & Mobility Operators
- Investments and venture capitalist firms
- Government and regulatory bodies
Research Methodology
Step 1: Identification of Key Variables
We map the USA vehicle subscription ecosystem across OEM captives, third-party platforms, dealer operators, insurers, and fleet logistics partners. We define variables such as fleet sourcing model, subscription term architecture, bundled-service scope, underwriting approach, and remarketing pathways using structured secondary research and documented program terms.
Step 2: Market Analysis and Construction
We build the market using a hybrid of top-down triangulation and bottom-up validation, incorporating program-level capacity signals, metro coverage, fleet sizing logic, and operational throughput proxies. We normalize definitions to ensure comparability across sources.
Step 3: Hypothesis Validation and Expert Consultation
We validate adoption drivers, churn levers, residual-value assumptions, and insurance bundling mechanics via expert interviews across OEM mobility teams, dealer groups, fleet operators, and insurance stakeholders, using structured questionnaires to standardize responses.
Step 4: Research Synthesis and Final Output
We consolidate findings into a single integrated model covering segment splits, competitive positioning, and operational benchmarks. We run consistency checks across assumptions, reconcile discrepancies in published estimates, and finalize insights through analyst review to ensure the market narrative aligns with observed platform mechanics.
- Executive Summary
- Research Methodology (Market Definitions & Boundary Conditions, Subscription vs Lease/Rental Delineation, Platform Typology Framework, Units of Measure Subscriber-Units Active Subscriptions Fleet-in-Service, Market Sizing Model Fleet-Based and Demand-Based, Data Triangulation OEM Dealer Rental Insurer DMV Signals, Primary Interview Modules Platform Operations Fleet Finance Insurance Dealer Groups Captives, Assumptions Register Mileage Bands Term Buckets Swap Rights, Currency of Pricing All-In Monthly Fee Components, Validation and Error Checks, Limitations and Confidence Scoring)
- Definition and Scope
- Market Genesis and Evolution
- Platform Models in the USA OEM-Led Dealer-Led Rental-Led Fintech Startup-Led
- Marketplace-Led
- Business Cycle and Demand Cycles Seasonality Used-Car Price Cycle Linkage
- Interest-Rate Sensitivity

- Growth Drivers
Flexible mobility demand signals
OEM inventory optimization levers
Used-car supply and remarketing channels
Connected-vehicle enablement
Employer mobility benefits adoption - Challenges
Insurance loss ratios and premium reset risk
Residual value volatility
State-by-state titling and tax complexity
Fraud and KYC pressure
Operational logistics cost density - Opportunities
EV access without ownership
Bundled insurance and safety scoring
Subscription-to-purchase funnels
Dealer group monetization
Commercial and gig-tiered subscriptions - Trends
Shorter commitment terms
EV-only subscription bundles
Embedded telematics-based pricing
Dynamic mileage structures
Instant approvals and digital onboarding - Regulatory & Policy Landscape
- SWOT Analysis
- Stakeholder & Ecosystem Analysis
- Porter’s Five Forces Analysis
- Competitive Intensity & Ecosystem Mapping
- By Value, 2019–2024
- By Active Subscription Units, 2019–2024
- By Fleet-in-Service Vehicles on Subscription, 2019–2024
- By Average All-In Monthly Fee ARPS, 2019–2024
- By Contribution Margin Pool, 2019–2024
- By Fleet Type (in Value %)
OEM Program Fleets
Dealer Group Fleets
Rental and Mobility Fleets
Startup and Fintech-Owned Fleets
Marketplace Aggregated Fleets - By Application (in Value %)
Single-Vehicle Fixed Subscription
Multi-Vehicle Swap Subscription
Month-to-Month Subscription
Commit-with-Exit Subscription
Usage-Based Subscription - By Technology Architecture (in Value %)
Standalone Platform Stack
OEM-Integrated Platform
Dealer DMS-Integrated Platform
Insurtech-Embedded Architecture
Marketplace and API-Led Architecture - By Connectivity Type (in Value %)
Embedded OEM Telematics
Aftermarket OBD Telematics
Hybrid Embedded plus OBD
App-Only Limited Telemetry
Advanced EV and Battery Telemetry - By End-Use Industry (in Value %)
Retail Consumers
Gig and Delivery Drivers
SME and Commercial Operators
Corporate and Employer Programs
Relocation and Temporary Residents - By Region (in Value %)
Tier-1 Metropolitan Areas
Tier-2 Growth Cities
Coastal Markets
Sunbelt Markets
Insurance-Regulated Cost Clusters
- Market Share Snapshot
- Cross Comparison Parameters (Fleet-in-Service and Sourcing Model, Subscription Term Architecture and Swap Rights, All-In Pricing Components and Fee Leakage, Underwriting and Approval Rules Credit and KYC, Insurance Model Embedded versus BYO and Claims Handling, Fulfillment SLA Delivery Time and Swap Turnaround, Telematics and Data Stack Risk Scoring, Remarketing Strategy and Residual Value Controls)
- Competitive Moats Fleet Access Captive Finance Advantage Insurance Leverage Dealer
- Footprint Technology Automation Brand Trust Unit Economics
- Pricing Architecture Benchmarking Entry Price Points Mileage Bands Swap Fees
- Deductibles Initiation Fees Add-on Packs
- Strategic Moves Tracker Partnerships Market Exits and Pauses Program Expansions EV
- Dealer Enablement Models
- Detailed Profiles of Major Companies
SIXT+
FINN
Free2move Car
Porsche Drive
Hyundai Evolve+
Autonomy
Flexcar
Enterprise Mobility Programs
Hertz Mobility Programs
Care by Volvo
Mercedes-Benz Collection
BMW Access
Cadillac BOOK
Nissan Switch
- Persona Mapping Urban Professional Credit-Builder EV Curious Family Upgrader Gig Worker SME Operator
- Subscription Funnel Diagnostics Lead Sources Approval Rate Time-to-Delivery Drop-Off Reasons NPS Drivers
- Pricing and Value Perception All-In Transparency Swap Value Insurance Embed Maintenance Trust
- Retention Mechanics Tenure Drivers Loyalty and Upgrade Paths Renewal versus Churn Reasons Win-back Playbooks
- By Value, 2025–2030
- By Active Subscription Units, 2025–2030
- By Fleet-in-Service, 2025–2030
- By Average All-In Monthly Fee ARPS, 2025–2030
- By Contribution Margin Pool, 2025–2030


 Request a Sample
 Ask for Customization
 Get a Quote
 Enquire Now