
 Download PDF
 Download PDF
Market Overview
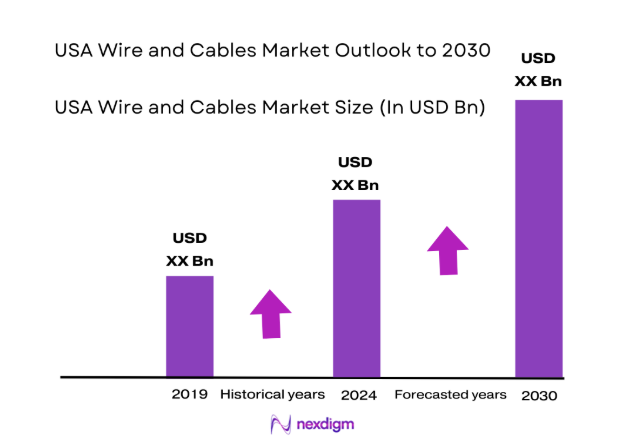
The USA Wire and Cables market current size stands at around USD ~ million, reflecting sustained demand across power transmission, building construction, telecommunications backbones, and electrification projects nationwide. Investment pipelines across grid hardening, renewable interconnections, and data center expansion continue to shape procurement cycles. Supply chain localization, conductor material substitutions, and compliance with evolving safety standards influence vendor strategies. Channel dynamics between utilities, EPC contractors, and distributors further define procurement efficiency and delivery reliability.
Demand concentration is strongest across coastal metros and high-growth Sun Belt corridors where grid modernization, hyperscale data centers, and transit electrification converge. Texas, California, Virginia, and New York exhibit dense project pipelines due to infrastructure renewal mandates, renewable integration needs, and digital connectivity requirements. Mature distributor networks, utility qualification frameworks, and state-level safety codes shape adoption patterns. Port access, regional manufacturing clusters, and logistics hubs enhance ecosystem maturity, while permitting regimes and resilience mandates guide deployment priorities.
Market Segmentation
By Application
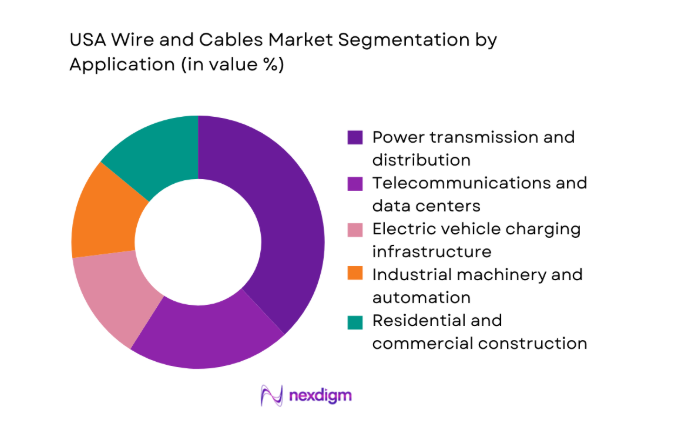
Power transmission and distribution remains dominant as utilities prioritize grid hardening, wildfire mitigation, and interconnection upgrades for renewable generation and storage assets. Data center and fiber backbone cabling is accelerating due to hyperscale campus expansion across Northern Virginia, Texas, and Arizona, driving demand for hybrid power-fiber solutions. EV charging corridors across interstate networks and urban fleets sustain medium-voltage and low-voltage cable installations. Industrial automation upgrades in reshoring manufacturing clusters increase demand for flexible control cables and specialty insulation. Residential and commercial retrofits continue steadily, supported by code-driven safety upgrades and energy efficiency mandates.
By Technology Architecture
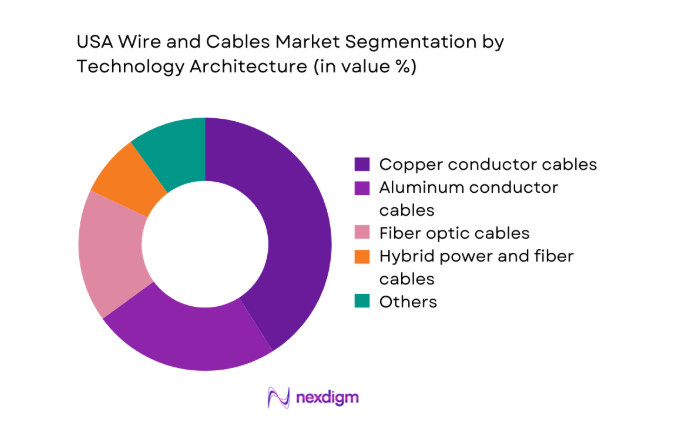
Copper conductor cables dominate critical and in-building applications due to conductivity, fire performance, and installer familiarity, while aluminum conductors gain traction in distribution networks to manage material cost pressures and weight constraints. Fiber optic and hybrid power-fiber architectures are expanding with data center densification and 5G backhaul needs. High-voltage AC remains prevalent for regional transmission, whereas HVDC corridors are adopted selectively for long-distance renewable integration and offshore wind export connections. Specialty fire-resistant and low-smoke zero-halogen insulation architectures are increasingly specified for transit, healthcare, and public infrastructure environments.
Competitive Landscape
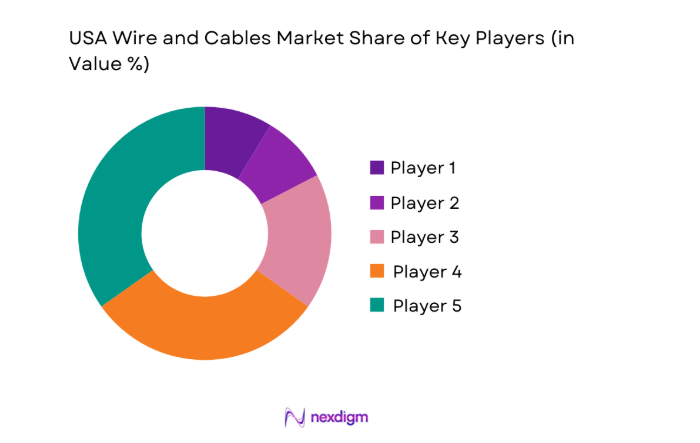
The competitive environment is shaped by vertically integrated manufacturers, regional specialists, and distributor-aligned brands competing on qualification breadth, delivery reliability, and compliance readiness. Vendor differentiation centers on voltage class coverage, polymer compounding depth, utility approvals, and logistics performance across multi-state project footprints.
| Company Name | Establishment Year | Headquarters | Formulation Depth | Distribution Reach | Regulatory Readiness | Service Capability | Channel Strength | Pricing Flexibility |
| Prysmian Group | 1879 | Milan, Italy | ~ | ~ | ~ | ~ | ~ | ~ |
| Nexans | 1897 | Paris, France | ~ | ~ | ~ | ~ | ~ | ~ |
| Southwire Company | 1950 | Carrollton, Georgia, USA | ~ | ~ | ~ | ~ | ~ | ~ |
| Encore Wire | 1989 | McKinney, Texas, USA | ~ | ~ | ~ | ~ | ~ | ~ |
| Belden | 1902 | St. Louis, Missouri, USA | ~ | ~ | ~ | ~ | ~ | ~ |
USA Wire and Cables Market Analysis
Growth Drivers
Grid modernization and hardening investments by utilities
Utility transmission and distribution programs expanded with 2023 capital plans across multiple states, supported by federal infrastructure allocations enacted in 2021. The Department of Energy reported 65 major grid resilience projects approved during 2023, with undergrounding initiatives across wildfire-prone counties in California and windstorm corridors in the Midwest. The Federal Energy Regulatory Commission advanced interconnection queue reforms in 2023 to accelerate renewable tie-ins, increasing conductor and accessory demand. State public utility commissions approved multiyear reliability filings in 2024 covering pole replacement cycles, substation retrofits, and underground ducting, expanding medium-voltage and high-voltage cable installations across urban and peri-urban networks nationwide.
Renewable energy capacity additions and interconnection upgrades
Utility-scale solar and wind interconnections accelerated through 2023 and 2024 as regional transmission organizations processed backlogged queues. The Energy Information Administration reported over 25 new large-scale renewable plants entering service during 2023 across Texas, California, and the Midwest, each requiring export cabling and substation connections. Offshore wind export routes advanced through federal permitting milestones in 2024 along the Atlantic seaboard, necessitating high-voltage export and array cables. Grid-scale storage projects connected to renewable nodes increased in 2024, driving medium-voltage feeder deployments and substation reconfigurations coordinated with regional transmission planning authorities and state clean energy mandates.
Challenges
Copper and aluminum price volatility impacting margins
Commodity price swings during 2023 and 2024 disrupted procurement planning for conductors and insulation compounds. The Bureau of Labor Statistics producer price indices for nonferrous metals showed monthly variability exceeding 10 points during several 2023 intervals, complicating contract pricing and inventory strategies. Import lead times fluctuated amid shipping disruptions reported by port authorities in 2024, tightening supply buffers for aluminum rod and specialty copper cathode. Utilities and EPC contractors adjusted procurement schedules and hedging practices, extending bid validity windows and increasing supplier qualification requirements to mitigate exposure, which constrained installation timelines for transmission upgrades and large construction programs nationwide.
Supply chain disruptions for insulation polymers and specialty metals
Polymer feedstock constraints affected cable insulation availability during 2023 due to petrochemical maintenance outages along the Gulf Coast. The Energy Information Administration reported refinery utilization dips during multiple 2023 quarters, tightening availability of PVC and XLPE inputs. Specialty steel and alloy components for armoring experienced shipping delays linked to 2024 Red Sea routing disruptions cited by maritime authorities. Domestic compounding capacity expansions required extended commissioning timelines, causing intermittent backlogs for fire-resistant and low-smoke formulations. These bottlenecks forced project rescheduling for transit electrification and data center builds, increasing coordination complexity across utilities, EPCs, and municipal permitting offices.
Opportunities
Undergrounding of distribution lines for resilience
State wildfire mitigation programs accelerated undergrounding mandates across high-risk counties during 2023 and 2024. California public utility commission directives expanded covered service territories, while Colorado and Oregon adopted resilience-oriented design standards for distribution corridors. The Federal Emergency Management Agency approved multiple resilience grants in 2024 supporting underground duct banks in storm-prone municipalities. Urban redevelopment projects integrated undergrounding to reduce outage frequency near critical facilities such as hospitals and transit hubs. These programs favor medium-voltage and low-voltage cable systems with enhanced insulation and moisture barriers, expanding installation scope across municipal rights-of-way and transportation corridors.
HVDC corridors for long-distance renewable integration
Interregional transmission planning advanced during 2023 as regional organizations coordinated long-distance corridors linking high-resource regions to load centers. The Department of Energy designated priority transmission corridors in 2024 across the Plains and Southwest to relieve congestion and improve interconnection throughput. Environmental impact statements progressed for multi-state routes connecting wind-rich areas to coastal demand nodes. HVDC technology enables lower losses over extended distances and supports asynchronous grid interties, increasing suitability for these corridors. The pipeline of permitted routes indicates sustained demand for high-voltage export cables, converter station interconnections, and specialized insulation systems.
Future Outlook
The USA Wire and Cables market is positioned for sustained momentum through 2030 as grid modernization, renewable integration, and digital infrastructure investments converge. Policy continuity at federal and state levels will shape permitting velocity and project sequencing. Urban resilience initiatives and interregional transmission planning are expected to rebalance demand toward underground and high-voltage architectures. Supply chain localization and standards harmonization will further influence procurement strategies.
Major Players
- Prysmian Group
- Nexans
- Southwire Company
- Encore Wire
- General Cable
- Belden
- LS Cable & System
- Sumitomo Electric Industries
- Furukawa Electric
- Leoni
- TE Connectivity
- AFL
- CommScope
- Okonite
- Houston Wire & Cable
Key Target Audience
- Investor-owned utilities and public power authorities
- Independent power producers and renewable developers
- EPC contractors and grid infrastructure integrators
- Data center operators and cloud service providers
- Electric vehicle charging network operators
- Industrial manufacturers and automation integrators
- Investments and venture capital firms
- Government and regulatory bodies with agency names including Department of Energy, Federal Energy Regulatory Commission, and state public utility commissions
Research Methodology
Step 1: Identification of Key Variables
Core variables were defined across voltage classes, conductor materials, insulation chemistries, application pathways, and end-use environments. Regulatory frameworks, utility qualification criteria, and channel structures were mapped to delineate scope boundaries. Project typologies across transmission, distribution, data centers, and EV corridors were structured to ensure coverage.
Step 2: Market Analysis and Construction
Demand drivers were constructed using grid modernization programs, renewable interconnection pipelines, and construction activity indicators. Application-level use cases were modeled across urban, peri-urban, and industrial contexts. Technology architecture adoption was evaluated across AC, HVDC, fiber, and hybrid deployments to structure comparative analysis.
Step 3: Hypothesis Validation and Expert Consultation
Assumptions on procurement cycles, installation constraints, and material substitution were validated through structured consultations with utilities, EPCs, distributors, and standards committees. Regulatory readiness and qualification pathways were reviewed with compliance specialists to test feasibility across states. Scenario stress-testing assessed exposure to permitting and logistics constraints.
Step 4: Research Synthesis and Final Output
Insights were triangulated across policy directives, infrastructure programs, and deployment pathways to reconcile inconsististencies. Findings were synthesized into application-specific narratives and technology architecture implications. The final output integrates ecosystem dynamics, regulatory influences, and operational constraints to support strategic planning and execution.
- Executive Summary
- Research Methodology (Market Definitions and conductor and cable taxonomy across voltage classes and insulation types, segmentation framework by application and end-use aligned to NEC and IEEE classifications, market sizing using utility capex, construction starts, EV charging rollouts and telecom network build-outs, revenue attribution through manufacturer shipment data and distributor channel audits, primary validation with utilities, EPC contractors)
- Definition and Scope
- Market evolution
- Usage and installation pathways
- Ecosystem structure
- Supply chain and channel structure
- Regulatory environment

- Growth Drivers
Grid modernization and hardening investments by utilities
Renewable energy capacity additions and interconnection upgrades
Data center expansion and fiber densification
EV charging network rollout and transportation electrification
Reshoring of manufacturing and industrial automation
Federal and state infrastructure funding programs - Challenges
Copper and aluminum price volatility impacting margins
Supply chain disruptions for insulation polymers and specialty metals
Skilled labor shortages in cable installation and grid projects
Lengthy permitting and right-of-way approvals
Aging grid constraints limiting new interconnections
Compliance costs with evolving fire safety and low-smoke regulations - Opportunities
Undergrounding of distribution lines for resilience
HVDC corridors for long-distance renewable integration
Medium-voltage cabling for utility-scale storage projects
Low-smoke zero-halogen and fire-resistant cable demand
Prefabricated cabling systems for modular construction
Recycling and circular sourcing of conductors - Trends
Shift toward aluminum conductors in distribution networks
Rising adoption of fiber-rich hybrid cables in data centers
Growth of underground cabling in urban deployments
Standardization around NEC and IEEE updates
Digital inventory and demand forecasting by distributors
Localization of cable manufacturing capacity - Government Regulations
- SWOT Analysis
- Stakeholder and Ecosystem Analysis
- Porter’s Five Forces Analysis
- Competition Intensity and Ecosystem Mapping
- By Value, 2019–2024
- By Volume, 2019–2024
- By Fleet Type (in Value %)
Overhead conductors
Underground cables
Submarine cables
Building wires and flexible cords - By Application (in Value %)
Power transmission and distribution
Renewable energy interconnections
Telecommunications and data centers
Industrial machinery and automation
Electric vehicle charging infrastructure
Residential and commercial construction - By Technology Architecture (in Value %)
Copper conductor cables
Aluminum conductor cables
Fiber optic cables
Hybrid power and fiber cables
High-voltage AC cables
High-voltage DC cables - By End-Use Industry (in Value %)
Utilities and grid operators
Construction and real estate
Telecommunications and cloud service providers
Manufacturing and industrial facilities
Transportation and EV infrastructure
Oil and gas and energy services - By Connectivity Type (in Value %)
Overhead line connectivity
Underground ducted connectivity
Direct-buried connectivity
Substation interconnections
Inter-array and export cable connectivity
In-building connectivity - By Region (in Value %)
Northeast
Midwest
South
West
- Market structure and competitive positioning
Market share snapshot of major players - Cross Comparison Parameters (product portfolio breadth, voltage class coverage, manufacturing footprint in the US, utility qualification and approvals, pricing competitiveness, delivery lead times, sustainability and recycled content strategy, channel partnerships with distributors)
- SWOT Analysis of Key Players
- Pricing and Commercial Model Bench marketing
- Detailed Profiles of Major Companies
Prysmian Group
Nexans
Southwire Company
Encore Wire
General Cable
Belden
LS Cable & System
Sumitomo Electric Industries
Furukawa Electric
Leoni
TE Connectivity
AFL
CommScope
Okonite
Houston Wire & Cable
- Demand and utilization drivers
- Procurement and tender dynamics
- Buying criteria and vendor selection
- Budget allocation and financing preferences
- Implementation barriers and risk factors
- Post-purchase service expectations
- By Value, 2025–2030
- By Volume, 2025–2030


 Request a Sample
 Ask for Customization
 Get a Quote
 Enquire Now