
 Download PDF
 Download PDF
Market Overview
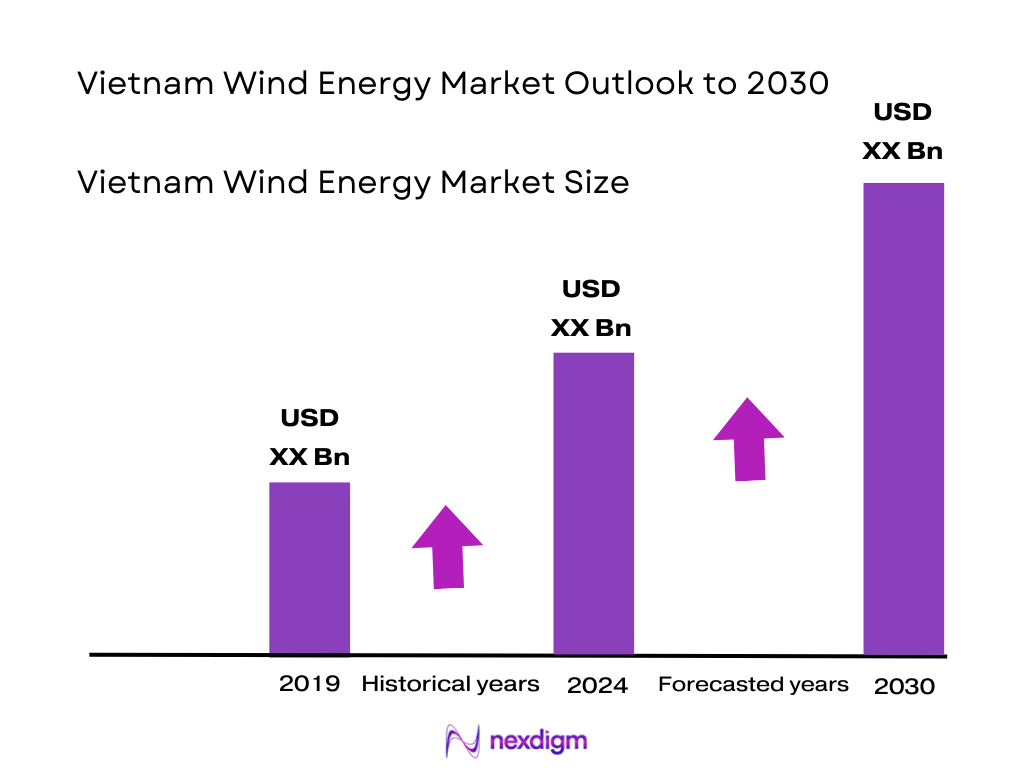
According to Nexdigm, the Vietnam offshore wind energy market was valued at approximately USD 12.5 billion in 2024 and is projected to expand at a robust CAGR of 14.2 % over the period to 2030. The Vietnam wind energy market is valued at USD 12.5 billion, driven by an accelerating demand for renewable infrastructure evidenced by Vietnam’s wind farms contributing increasingly to total power generation. The push comes from supportive government plans like PDP8, portals upgrading, and investors reacting to strong onshore and offshore potential. Installed capacity continues to rise, influencing investment flows and driving market scale.
Vietnam leads in Southeast Asia’s offshore wind space due to its extensive coastline rich in high-wind-speed zones, deepwater potential, and fast-track regulatory targets. Key coastal provinces—such as Quang Tri and Bach Long Vi—garner attention due to wind resource density, proximity to ports for developer access, and strong provincial government support. These regions dominate strategic project siting because of favorable physical and policy conditions.
Market Segmentation
By Resource Type
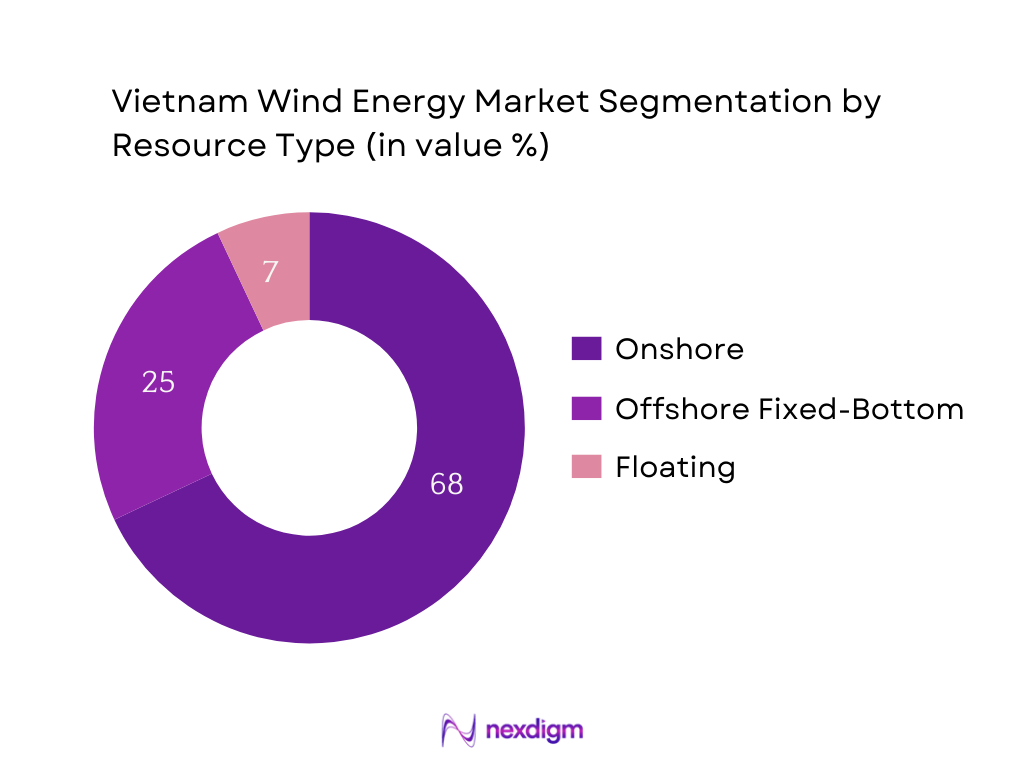
Vietnam’s wind energy market is segmented into onshore, offshore fixed-bottom, and floating. Currently, onshore wind holds the dominant market share due to its lower capital intensity, more mature regulatory framework, and existing infrastructure base. Developers favor onshore projects because they face fewer permitting hurdles and can leverage existing grid interconnections managed by EVN. Onshore installations are quicker to deploy and have been supported historically through feed-in tariffs and favorable provincial policies. In contrast, offshore fixed-bottom projects, though growing, are constrained by higher costs and permitting complexity, while floating remains nascent. Therefore, onshore wind remains the backbone of Vietnam’s wind energy market in terms of value and installed capacity.
By Project Phase
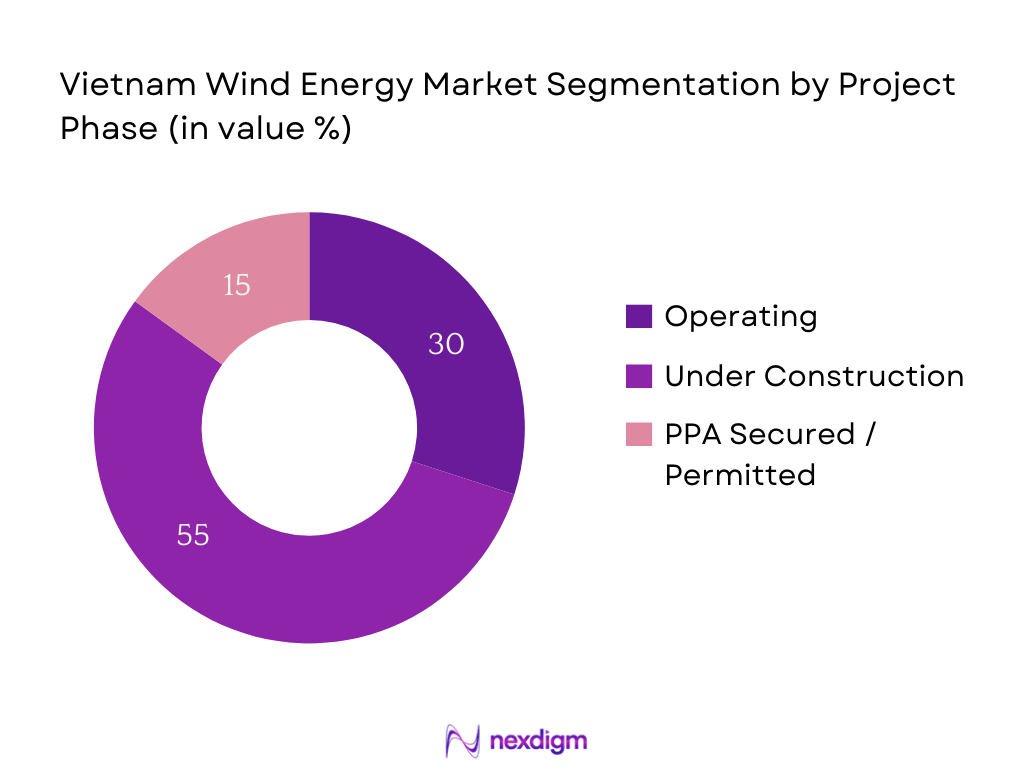
Vietnam’s wind energy market segments into operating, under construction, and PPA secured/permitted projects. The under-construction segment dominates current market share, reflecting the country’s strong near-term momentum in deploying wind capacity. This surge is driven by developers accelerating build-out to take advantage of expiring feed-in tariff schemes and to align with PDP8 targets. Port upgrades, financing vehicles, and EPC readiness have enabled many projects to move from planning to construction quickly. Meanwhile, operating assets remain fewer in number relative to the construction pipeline, and PPA secured projects lag due to the slow permitting and grid-connection processes. Hence, under-construction projects currently constitute the highest share in the market phase segmentation.
Competitive Landscape
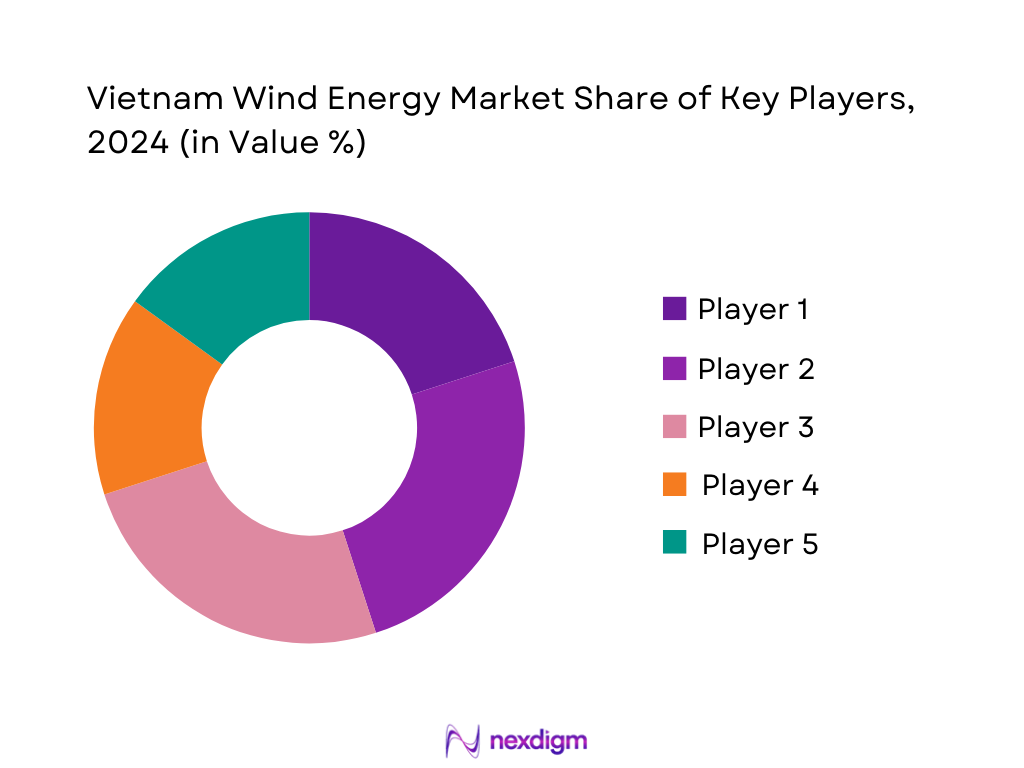
Vietnam’s wind energy market is characterized by a few large-scale developers and OEMs. Consolidation among major players—both local (e.g., Trungnam Group, PCC1) and international (e.g., Ørsted, CIP)—highlights their influence in shaping project pipelines, securing port access, and negotiating Power Purchase Agreements. These organizations hold sway through expertise in offshore project execution, access to finance, and strategic partnerships, thereby reinforcing barriers to entry for smaller players.
| Company | Est. Year | Headquarters | Avg Wind Speed (m/s @100 m) | Port Access (Indicator) | Turbine Type Dominant | Foundation Approach | Offtake Route | Developer Ownership Type |
| Trungnam Group | 2004 | Hanoi, Vietnam | – | – | – | – | – | – |
| ACEN Vietnam (BIM Group) | 2011 | Ho Chi Minh City | – | – | – | – | – | – |
| BCG Energy (Bamboo Capital) | 2012 | Ho Chi Minh City | – | – | – | – | – | – |
| PCC1 (PC1 Group) | 2002 | Hanoi, Vietnam | – | – | – | – | – | – |
| RENOVA Inc. (Vietnam JV) | 2015 | Tokyo / Hanoi | – | – | – | – | – | – |
Vietnam Wind Energy Market Analysis
Growth Drivers
PDP8 Capacity Allocation
Vietnam’s national power plan sets explicit room for wind—anchored by offshore capacity of 6,000 MW for domestic demand and 21,880 MW of land-based wind by the planning horizon—against a real operating baseline of 80,555 MW of total installed capacity and 280.6 billion kWh of system generation. Wind already produced 11,367 million kWh in the latest full year, with system peak load at 46,348 MW. These binding targets, layered onto an electricity market that hit 1.02 billion kWh of daily consumption and 49,533 MW Pmax within a single month, create immediate headroom for new wind build and grid-integration projects.
Corporate Renewable Demand
Industrial activity and exports are pushing corporate clean-power procurement. Vietnam’s merchandise exports reached US$405.53 billion, while manufacturing value added posted US$116,383.68 million (current US$). On the grid, EVN logged 135.64 billion kWh in six-month retail sales and a one-day consumption high of 1.02 billion kWh, with Pmax at 49,533 MW. The legal pathway for direct procurement is now operational under Decree 80/2024/ND-CP, enabling large consumers to contract wind output through grid-based or private-wire models—critical for export-oriented manufacturers subject to supply-chain decarbonization.
Market Challenges
Grid Bottlenecks
Transmission congestion remains material. The system ran 280.6 billion kWh with a 46,348 MW peak, and north–south transfers were reported “regularly high,” with 121.47 billion kWh transmitted in six months—signaling limited corridor headroom. By the end of the preceding year, NLDC cited 20 overloaded points on the grid and 220 plants compelled to reduce output. Even with 47 project starts and 57 energizations across 110–500 kV in half a year, the mismatch between resource zones and load centers continues to constrain wind dispatch.
Curtailment Risk
Load spikes and regional imbalances elevate curtailment risk for wind. EVN recorded a one-day consumption of 1.02 billion kWh and Pmax 49,533 MW within the same month; yet annual wind generation was 11,367 million kWh against 25,702 million kWh solar and 80,904 million kWh hydro, creating volatility when hydrology or heat waves shift dispatch. NLDC highlighted 20 overloaded grid points and 220 curtailed plants, while EVN reported sustained south-to-north transfers of high volumes—conditions under which wind output is frequently constrained to maintain system stability.
Opportunities
Floating Wind Development
Resource and bathymetry favor large-scale floating. Vietnam’s coastline extends ~3,260 km with prime wind corridors off the south-central provinces where mean speeds exceed 8 m/s at hub height. Recent assessments delineate deep-water areas between 50–1,000 m suited to floating foundations near southern load centers—reducing export cable distance and accommodating larger rotors. Policy signals in PDP8 reserve 6,000 MW for offshore, while World Bank program work confirms exceptional close-to-shore resource. These facts position floating wind as an immediate development lane where fixed-bottom options are depth-constrained.
BESS Co-location
Storage can unlock higher wind dispatch and grid services. The system reached 1.02 billion kWh of one-day consumption and Pmax 49,533 MW, while annual wind and solar already delivered 11,367 million kWh and 25,702 million kWh, respectively—ample variable output for charging. Vietnam is executing its first pumped-storage project at 1,200 MW, demonstrating a system-level appetite for flexibility assets that can be complemented by co-located battery storage at wind plants for firming, ramp control, and congestion relief. Transmission buildout—25,236 km of lines and 153 substations—provides interconnection nodes where storage can shave peaks and minimize curtailment.
Future Outlook
Over the next six years, Vietnam’s wind energy market is anticipated to expand significantly. Strong government targets, such as 38 GW of onshore capacity by 2030 under PDP8, alongside emerging offshore ambitions, will fuel demand. Continued improvements in port infrastructure, regulatory clarity, and DPPA frameworks are expected to foster confidence among investors. Simultaneously, offshore fixed-bottom and floating technologies will mature, enabling deeper water exploitation and integration with energy storage and hydrogen pathways. These combined forces will sustain robust market growth and diversification.
Major Players
- Trungnam Group
- ACEN Vietnam (BIM Group)
- BCG Energy (Bamboo Capital)
- PCC1 (PC1 Group)
- RENOVA Inc.
- Enterprize Energy (Thang Long Wind)
- Copenhagen Infrastructure Partners (La Gan)
- Ørsted (with T&T Group)
- T&T Group
- PNE AG
- Super Energy Corporation Vietnam
- GE Renewable Energy
- Vestas
- Siemens Gamesa
- PTSC M&C (Petrovietnam Services)
Key Target Audience
- Investments and venture capitalist firms
- Major developers & independent power producers
- Government and regulatory bodies (Ministry of Industry & Trade – MOIT; Electricity Regulatory Authority of Vietnam – ERAV; EVN Grid and NLDC)
- Project financiers and infrastructure funds
- OEMs and EPC contractors
- Port and logistics operators
- Energy utilities and corporate offtakers
- Strategic investment arms of industrial conglomerates
Research Methodology
Step 1: Identification of Key Variables
The first step involves developing a comprehensive ecosystem map capturing stakeholders across Vietnam’s wind energy sector—developers, OEMs, authorities, financiers, logistic providers. This is built using extensive desk research and secondary data from government gazettes, industry databases, and proprietary project trackers to define critical variables affecting market size and dynamics.
Step 2: Market Analysis and Construction
This phase aggregates historical and current datasets on project capacity, investment values, turbine deployment, and tariff frameworks. We analyze construction timelines, COD performance, and generation data, cross-validated across sources (MOIT data, developer disclosures, PDP filings) to estimate market size and forecast trajectories.
Step 3: Hypothesis Validation and Expert Consultation
We formulate market hypotheses relating to growth drivers and risks, then test these through structured interviews with industry executives from developers, OEMs, regulators, and port authorities. These engagements provide validation for assumptions, real-world cost benchmarks, and project implementation hurdles.
Step 4: Research Synthesis and Final Output
Finally, we integrate quantitative findings with qualitative insights from field interviews. Direct discussions with leading companies refine understanding of segment trends, project pipelines, and risk profiles, ensuring that the report’s outputs are both accurate and aligned with market realities.
- Executive Summary
- Research Methodology (Market Definitions and Assumptions, Abbreviations, Market Sizing Approach, Consolidated Research Approach, Understanding Market Potential Through In-Depth Industry Interviews, Primary Research Approach, Limitations and Future Conclusions)
- Definition and Scope
- Market Genesis and Policy Evolution
- Timeline of Major Projects and Developers
- Wind Resource Map and Regional Distribution
- Supply Chain and Value Chain Analysis (Turbine OEMs, Tower Manufacturing,
- Blade Production, Foundations, Cables, Offshore Substations, Ports and Logistics)

- Growth Drivers (PDP8 Capacity Allocation, Corporate Renewable Demand, DPPA Pilot Projects, Port Infrastructure Upgrades, Industrial Decarbonization Load, Offshore Supply Chain Development)
- Market Challenges (Grid Bottlenecks, Curtailment Risk, Typhoon Design Constraints, Seabed Allocation Process, Vessel and Installation Equipment Shortages)
- Opportunities (Floating Wind Development, BESS Co-location, Repowering Opportunities, Green Hydrogen Production, Cross-border Export Potential)
- Trends (Turbine Upscaling, XXL Blade Deployment, Hybrid Wind-Solar-BESS Projects, Digital O&M Adoption)
- Government Regulations (Auction & Tariff Framework, PPA Bankability, DPPA Decree, Maritime Permitting, Local Content Rules, Grid Code Requirements, Curtailment Compensation Provisions)
- SWOT Analysis
- Stakeholder Ecosystem (MOIT, EVN, NLDC, MONRE, Provincial Authorities,
- Port Operators, EPC Contractors, OEMs, Lenders, Insurers)
- Port, Yard & Logistics Readiness (Quay Length, Draft, Crane Capacity, Laydown Area, Fabrication Throughput)
- By Value, 2019-2024
- By Installed Capacity, 2019-2024
- By Project Count, 2019-2024
- By Average Tariff, 2019-2024
- By Resource Type (In Value %)
Onshore
Nearshore
Offshore Fixed-Bottom
Floating
Hybrid Wind-Solar-Storage - By Project Phase (In Value %)
Operating
Under Construction
PPA Secured
Site Survey / Feasibility Study
Announced - By Capacity Class (In Value %)
0–30 MW
31–100 MW
101–300 MW
301–600 MW
Above 600 MW - By Turbine Rating (In Value %)
Below 3 MW
3–5 MW
5–8 MW
8–12 MW
Above 12 MW - By Ownership/Developer Type (In Value %)
State-Owned Enterprises (SOE)
Local Private IPP
Foreign IPP
Joint Ventures
Utility Affiliates - By Offtake Route (In Value %)
EVN PPA
Corporate DPPA
Captive / Wheeling
Cross-border Export - By Region / Sea Basin (In Value %)
Northern
North Central
Central Highlands
South Central
Southeast
Mekong Delta
Gulf of Tonkin
South Central Offshore
Southwest Offshore - By Component / System (In Value %)
WTG (Wind Turbine Generators)
Towers
Blades
Nacelle / Drive-train
Foundations
Offshore Substations
Array / Export Cables
SCADA & Grid Code Compliance
BESS (Battery Energy Storage Systems)
- Market Share of Major Players by Value / Capacity (Installed MW, Committed MW, Announced MW)
- Cross Comparison Parameters (Lease Area, Distance to Shore, Water Depth, Mean Wind Speed @100 m, Turbine Rating & Rotor Diameter, Foundation Concept, Grid Interconnection Voltage, Offtake Route & Status)
- SWOT Analysis of Major Players
- Tariff and Cost Benchmarks (PPA Tariffs, EPC Cost Ranges, O&M Cost Drivers)
- Detailed Profiles of Major Companies
Trungnam Group
ACEN Vietnam (BIM Group)
BCG Energy (Bamboo Capital)
PCC1 (PC1 Group)
RENOVA Inc.
Enterprize Energy (Thang Long Wind)
Copenhagen Infrastructure Partners (La Gan)
Ørsted (with T&T Group)
T&T Group
PNE AG
Super Energy Corporation Vietnam
GE Renewable Energy
Vestas
Siemens Gamesa
PTSC M&C (Petrovietnam Services)
- Market Demand and Utilization
- Industrial Clusters and High-Load Centers
- Corporate Buyers and RE100 Commitments
- PPA Tenor and Tariff Preferences
- Creditworthiness and Procurement Criteria
- By Value, 2025-2030
- By Installed Capacity, 2025-2030
- By Average Tariff, 2025-2030


 Request a Sample
 Ask for Customization
 Get a Quote
 Enquire Now