
 Download PDF
 Download PDF
Market Overview
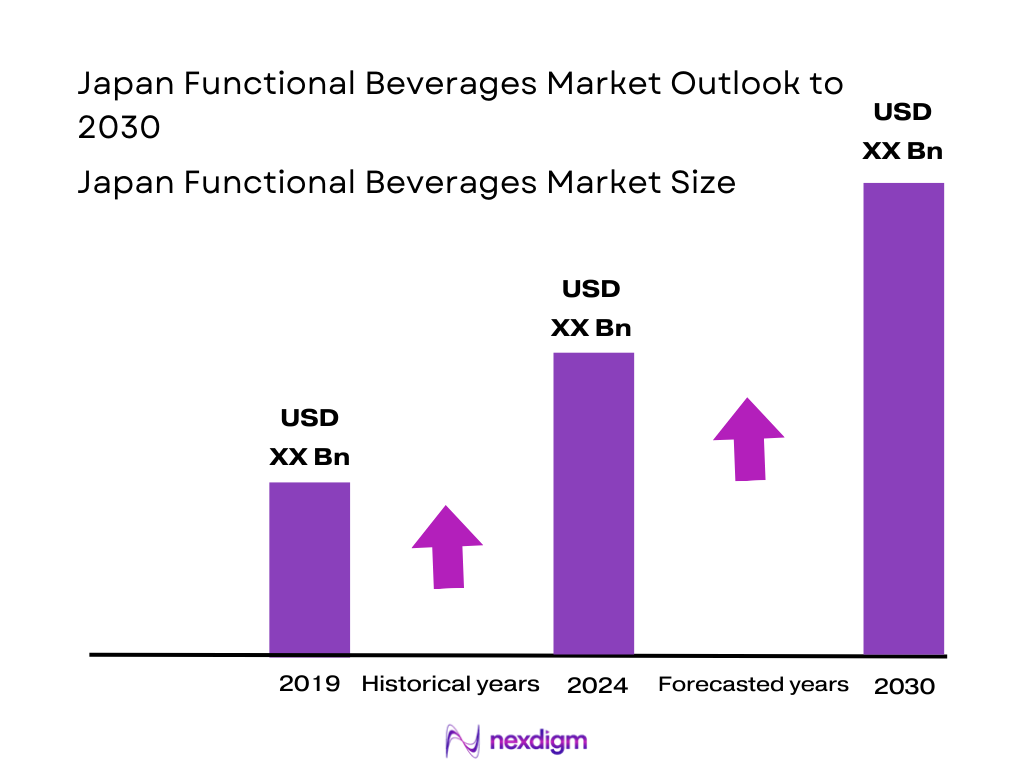
The Japan functional beverages market is valued at USD 7,500.0 million. This valuation reflects robust consumer demand for beverages offering health benefits such as immunity boosting, digestive support, and cognitive enhancement—demands amplified by Japan’s aging population, higher health awareness, and preference for on-the-go wellness products.
Major urban centers—Tokyo (Kanto), Osaka (Kansai), and Nagoya (Chubu)—dominate market activity, driven by dense population clusters, premium consumer spending power, and extensive retail and vending infrastructures ideal for functional beverage distribution. Their dynamic food and beverage sectors, coupled with rapid modern lifestyle trends, enhance convenience-driven consumption of functional drinks across metropolitan Japan.
Market Segmentation
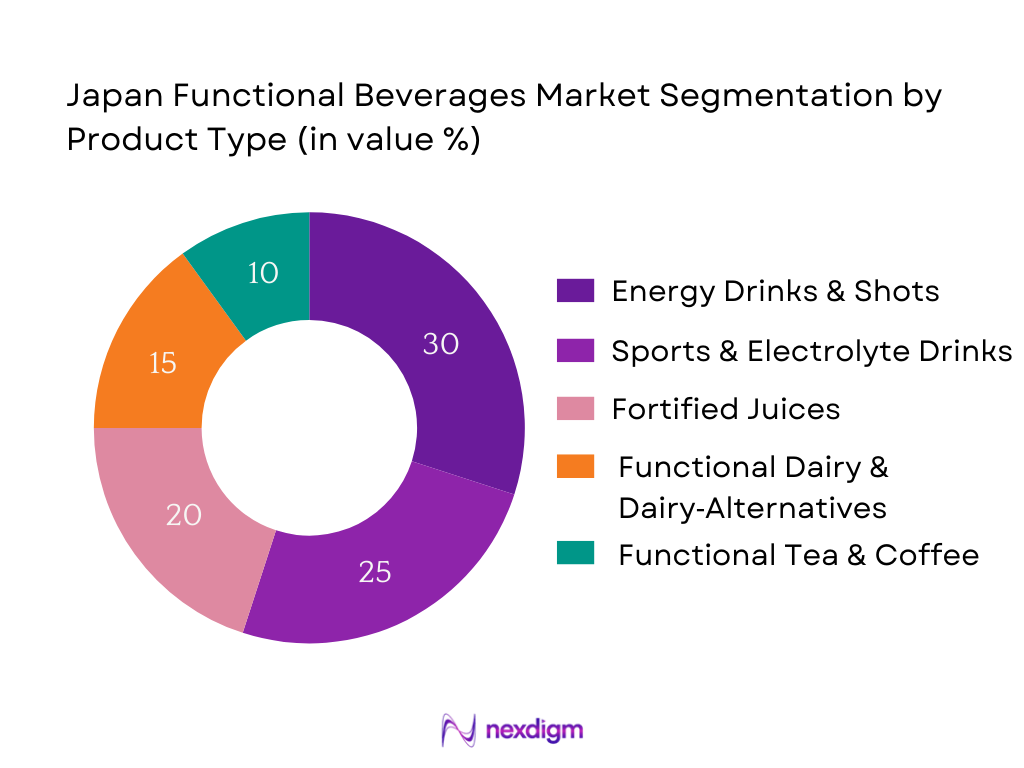
By Product Type
Energy drinks and shots hold the largest market share in Japan. Their dominance stems from widespread consumer preference for immediate functional benefits—particularly energy, focus, and enhanced alertness—in line with busy urban lifestyles. These products benefit from strong branding, aggressive marketing, and high visibility in vending machines and convenience stores nationwide. Additionally, continuous innovation in flavors and formulations keeps consumers engaged and loyal to the segment.
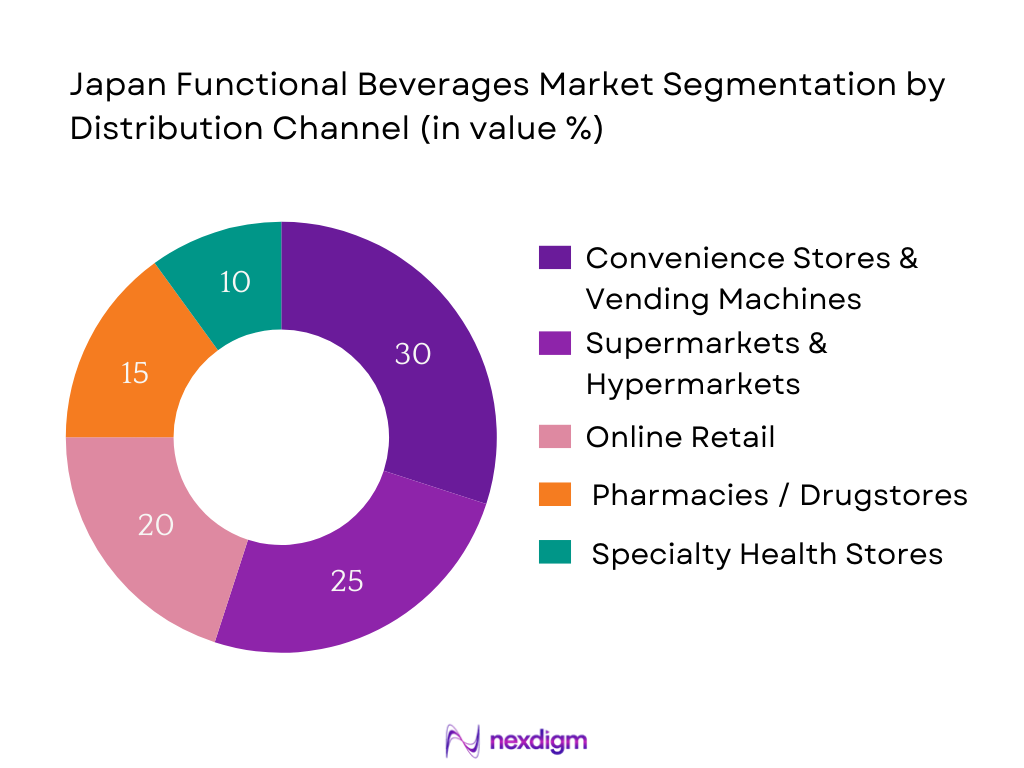
By Distribution Channel
This channel leads due to unparalleled reach in Japan’s daily life—vending machines and convenience store outlets are ubiquitous in urban and suburban zones, providing 24/7 access to functional beverages. Their strategic product placement and high visibility facilitate impulse purchases. Moreover, partnerships with prominent functional beverage brands ensure optimal product distribution and promotional presence in these convenient touchpoints.
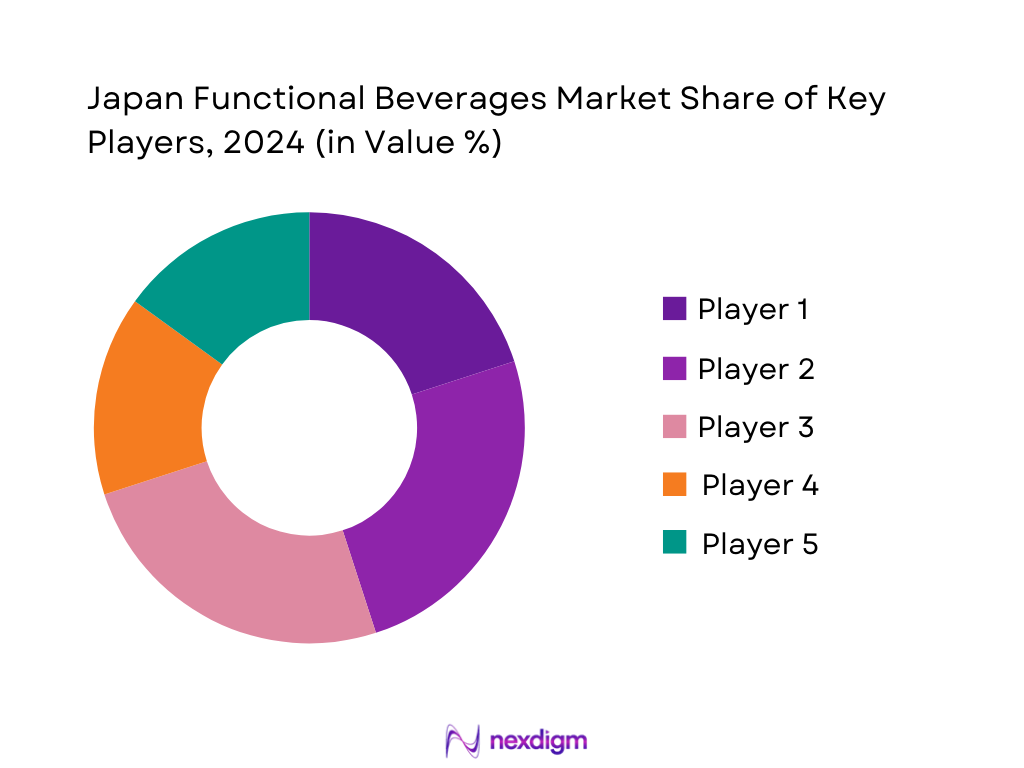
Competitive Landscape
The Japan functional beverages market exhibits significant concentration, with a few major domestic and multinational players dominating through strong brand equity, extensive distribution networks, and FOSHU/FFC-certified product portfolios that command consumer trust and regulatory approval.
| Company | Establishment Year | Headquarters | FFC‑Certified SKUs | Functional Ingredient Focus | Distribution Reach | R&D Innovation (New SKUs p.a.) | Premium SKU % | E‑commerce Sales Mix |
| Yakult Honsha | – | Tokyo, Japan | – | – | – | – | – | – |
| Otsuka Pharmaceutical | – | Tokyo, Japan | – | – | – | – | – | – |
| Asahi Group Holdings | – | Tokyo, Japan | – | – | – | – | – | – |
| Kirin Holdings | – | Tokyo, Japan | – | – | – | – | – | – |
| Suntory Beverage & Food | – | Osaka, Japan | – | – | – | – | – | – |
Japan Functional Beverages Market Analysis
Growth Drivers
FFC Policy Uptake
The government’s Household Income and Expenditure Survey reports that average monthly household income reached ¥636,155 in 2024, increasing by ¥27,985 in nominal terms from the previous year, while expenditures rose to ¥300,243, up by ¥6,194. This disposable income growth supports consumer spending on higher-value functional beverages carrying FFC (Foods with Function Claims) certifications. The affordability afforded by this income uplift enables uptake of premium functional formulations. Increased FFC policy adoption in product portfolios aligns with rising consumer capacity to pay more for scientifically substantiated health benefits in their beverage choices.
Aging Population Trends
As of September 2024, Japan had 36 million people aged 65 or older—comprising 29 percent of the total population—with an additional 10 percent aged 80 or older. This demographic significantly enlarges the consumer base seeking health‑oriented beverages such as those addressing immunity, digestion, and cognitive support. Simultaneously, births dropped to only 720,988, marking the lowest since 1899 — reinforcing the shift toward older‑skewed demand. Functional beverage manufacturers stand to benefit from tailoring products to this aging demographic with high health awareness and regular spending on wellness.
Market Challenges
FOSHU Approval Costs
The financial burden of obtaining FOSHU (Foods for Specified Health Uses) certification remains a challenge for smaller producers. While exact application costs are not publicly itemized, the process requires comprehensive clinical trials, dossier preparation, and regulatory submissions. In 2024, household consumption expenditures averaged ¥300,243 per month, yet non-working elderly households—typical target consumers—had disposable income of ¥219,811, with expenditures exceeding income by ¥34,642, funded via asset withdrawal. Limited disposable income in key consumer segments places pricing constraints on FOSHU‑certified products, limiting broader market accessibility.
Ingredient Import Dependency
Japan’s functional beverage sector relies heavily on imported probiotic strains, botanical extracts, and specialty nutrients, often sourced from Europe and North America. Concurrently, Japan’s per capita household final consumption expenditure stands at approximately $33,956 nominal, positioning consumers to expect diverse, high-quality ingredients. However, reliance on imported inputs exposes manufacturers to exchange rate risk and global supply disruptions. Amid flat GDP growth of 0.8 percent in 2024, businesses navigate tight margins and fluctuating costs for critical functional ingredients sourced overseas.
Opportunities
D2C Brand Expansion
In 2024, Japan’s nominal GDP per capita was $33,956, reflecting strong consumer purchasing power that supports niche product adoption. With rising household consumption and increasing digital penetration, direct-to-consumer (D2C) channels present an opportunity for functional beverage brands to engage consumers directly, bypass retail overhead. The average monthly household consumption expenditure of ¥300,243 indicates room for discretionary spending on specialized health drinks. Enhanced digital engagement strategies and personalized marketing can drive trial and loyalty in health-conscious demographics.
Personalized Nutrition Beverages
As of 2024, Japan’s elderly population reached 36 million, representing a sizable cohort of health-conscious consumers with varied wellness needs. At the same time, birth rates dropped to 720,988, signifying shrinking younger cohorts and reinforcing the need for tailored nutrition solutions. Personalized nutrition beverages—customized for immunity, digestion, cognitive support, or metabolic health—can tap into this demographic complexity. Leveraging macroeconomic stability and demographic insights, brands offering customization stand to differentiate themselves and capture niche consumer segments seeking targeted wellness solutions.
Future Outlook
Looking ahead, Japan’s functional beverages market is expected to exhibit robust growth driven by rising health consciousness, ongoing innovation in functional formulations, increasing digital and e‑commerce adoption, and evolving retail formats tailored to convenience. Brands that leverage validated functional claims, clean-label formulations, and enhanced distribution strategies—from D2C channels to modern vending—will have a decisive competitive edge.
Major Players
- Yakult Honsha
- Otsuka Pharmaceutical
- Asahi Group Holdings
- Kirin Holdings
- Suntory Beverage & Food
- ITO EN
- Coca‑Cola Bottlers Japan
- Monster Energy Japan
- Nestlé Japan
- PepsiCo Japan
- Taisho Pharmaceutical
- Meiji Holdings
- Calpis (Calpis Co., Ltd.)
- Pokka Sapporo Food & Beverage
- DyDo Group Holdings
Key Target Audience
- Consumer Packaged Goods (CPG) Companies – Functional Beverage Divisions
- Retail Chains – Beverage Category Managers
- Investment & Venture Capitalist Firms
- Food & Beverage Manufacturers – R&D Strategy Teams
- Government and Regulatory Bodies
Research Methodology
Step 1: Identification of Key Variables
We begin by mapping the functional beverages ecosystem in Japan, identifying stakeholders like functional beverage producers, ingredient suppliers, certification bodies, and distribution partners. This phase is anchored in extensive desk research using industry reports and proprietary databases to define critical market drivers and constraints.
Step 2: Market Analysis and Construction
Historical sales data and retail scanner inputs provide insights into market size by value and volume. We analyze channel performance, SKU segmentation, and pricing to construct a robust base-year market estimation, ensuring validity through data triangulation.
Step 3: Hypothesis Validation and Expert Consultation
Hypotheses regarding growth drivers, consumer demand, and innovation trends are validated through structured interviews (e.g., CATI) with industry experts: senior managers from beverage firms, FOSHU/FFC regulatory specialists, and distribution executives.
Step 4: Research Synthesis and Final Output
In-depth interactions with leading functional beverage companies supply granular insights on product pipelines, innovation strategy, and sales performance. These insights align with bottom-up calculations to deliver a validated, comprehensive market analysis and forecast.
- Executive Summary
- Research Methodology (Market Definitions and Assumptions, Abbreviations, Market Sizing Approach, Data Triangulation, Primary Research Approach, Forecasting Techniques, Limitations and Future Scope)
- Definition and Scope
- Market Genesis and Evolution Timeline (FOSHU and FFC milestones)
- Regulatory Landscape Overview (FOSHU, FFC, Ministry of Health)
- Distribution Landscape and Channel Infrastructure
- Raw Material Sourcing and Supply Chain Structure
- Import–Export Scenario (Functional Ingredients, Probiotic Strains, Botanical Extracts)
- Ecosystem Mapping (Ingredient Suppliers, Contract Bottlers, Certifying Bodies)

- Key Growth Drivers (FFC Policy Uptake, Aging Population Trends, Immunity-Focused Consumption, Urban Lifestyle Changes, Vending Infrastructure Penetration, Probiotic R&D Support)
- Market Challenges (FOSHU Approval Costs, Ingredient Import Dependency, Functional Mislabeling Risk, Regulatory Compliance Delays, Channel Fragmentation)
- Emerging Opportunities (D2C Brand Expansion, Personalized Nutrition Beverages, Domestic Strain Development, Functional Carbonated Beverages, Export of Japanese Functional Brands)
- Key Trends (Clean Label Movement, Botanicals in Energy Drinks, Functional RTD Tea Expansion, Reduced Sugar Innovations, Hybrid Beverages)
- Regulatory Framework (FOSHU Certification Procedures, FFC Claims Audits, Health and Nutrient Labeling Norms, Advertising Guidelines)
- SWOT Analysis
- Stakeholder Ecosystem Analysis
- Porter’s Five Forces Analysis
- By Value, 2019-2024
- By Volume, 2019-2024
- By Average Selling Price, 2019-2024
- By Product Type (In Value %)
Energy Drinks
Electrolyte & Sports Drinks
Fortified Juices
Functional Dairy and Dairy-Alternative Beverages
Functional RTD Tea and Coffee - By Functional Benefit (In Value %)
Digestive Health (Probiotics/Prebiotics)
Immunity Boosting (Vitamin C, Elderberry, etc.)
Cognitive Health (Adaptogens, Nootropics)
Weight Management & Metabolism
Endurance & Physical Performance - By Distribution Channel (In Value %)
Convenience Stores
Supermarkets & Hypermarkets
Vending Machines
Pharmacies & Drug Stores
Online Retail Platforms - By Packaging Format (In Volume %)
PET Bottles
Aluminum Cans
Aseptic Cartons
Glass Bottles
Sachets and Shots - By Region (In Value %)
Kanto
Kansai
Chubu
Kyushu-Okinawa
Hokkaido-Tohoku
- Market Share Analysis of Major Players (In Value/Volume)
- By Product Type
By Distribution Channel
By Functional Benefit Segment - Cross Comparison Parameters (FFC-Certified Product Count, Number of Functional SKUs, Ingredient Innovation, Retail Footprint, Distribution Coverage, Premium Product Range, Sustainability Index, Direct-to-Consumer Sales Ratio)
- SWOT Analysis of Major Players
- SKU-wise Price Benchmarking (Channel-Wise and Format-Wise)
- Detailed Company Profiles
Yakult Honsha
Otsuka Pharmaceutical
Asahi Group Holdings
Kirin Holdings
Suntory Beverage & Food
ITO EN
Coca‑Cola Bottlers Japan
Monster Energy Japan
Nestlé Japan
PepsiCo Japan
Taisho Pharmaceutical
Meiji Holdings
Calpis (Calpis Co., Ltd.)
Pokka Sapporo Food & Beverage
DyDo Group Holdings
- Urban vs Rural Consumption Trends
- Age Group-Based Preferences (Young Adults, Working Professionals, Seniors)
- Motivational Consumption Triggers (Health Consciousness, Fitness Trends, Work-Life Fatigue, Mental Alertness Needs)
- Product Affinity and Switching Behavior
- Purchase Decision Cycle
- By Value, 2025-2030
- By Volume, 2025-2030
- By Average Selling Price, 2025-2030


 Request a Sample
 Ask for Customization
 Get a Quote
 Enquire Now