
Introducing India
Economy
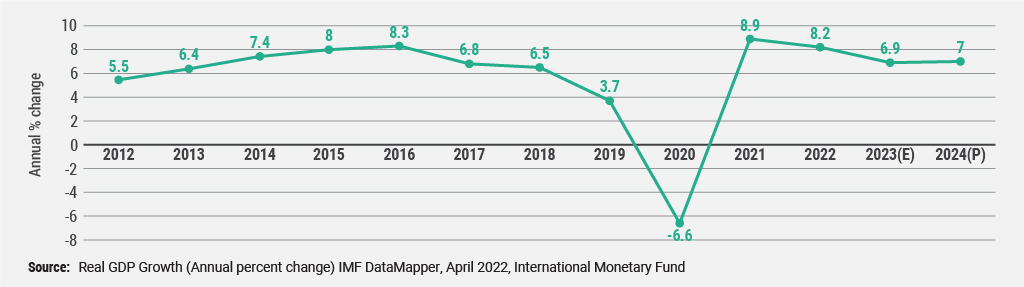
India is the third-largest economy in terms of Gross Domestic Product (GDP) based on Purchasing Power Parity (PPP). India has been one of the fastest-growing economies over the last decade.
India continues to be one of the fastest-growing major economies in the world. The Provisional Estimates released by the Ministry of Statistics and Program Implementation place Real GDP growth for FY 2025 to 26 at 7.7 %, up from 7.1 % in FY 2024 to 25, with Real GDP at constant prices reaching approximately USD 3,384.5 billion. Nominal GDP reached approximately USD 3,627.9 billion in FY 2025 to 26, registering growth of 8.9 % over the previous year7.
Note: USD values are calculated using an exchange rate of USD 1 = INR 95.58.
The service sector continues to be the largest contributor to India's economy, accounting for 56.5% of Gross Value Added (GVA), followed by the industry sector with a 27.6% share, and agriculture accounting for 15.9% in FY 2025 to 269. However, agriculture remains the largest employer, engaging 46.1% of the total workforce, followed by the service sector.10
The Indian economy has held firm amid a more turbulent global environment, shaped by trade tensions and the outbreak of conflict in West Asia in early 2026, with steady private consumption, robust investment, and buoyant services and industrial activity underpinning growth, even as global expansion remained a modest 3.4% in 2025. Both fiscal and monetary policy continued to support this stability, with the central government advancing fiscal consolidation while prioritizing capital expenditure, and headline inflation easing further driven by of a sharp contraction in food prices. Amid this backdrop of heightened global uncertainty, India retained its position as the world’s fastest-growing large economy, underpinned by robust macroeconomic fundamentals and proactive policy support11.
In line with India's vision of becoming 'Atmanirbhar,' Production Linked Incentive (PLI) Schemes have been introduced for 14 key sectors with a total outlay of approximately USD 20.0 billion. As of 31 December 2025, 836 applications have been approved across these sectors, attracting cumulative investment 7. Ministry of Statistics & Programme Implementation, https://www.pib.gov.in/ PressReleasePage.aspx?PRID=2269286®=48&lang=2 8. Trading Economics, https://tradingeconomics.com/india/currency 9. https://anantamias.com/gdp-of-india/ 10. Economic survey, https://www.indiabudget.gov.in/economicsurvey/doc/eschapter/echap06. pdf 11. RBI, https://www.rbi.org.in/scripts/AnnualReportPublications.aspx?Id=1462#F 12. https://www.pib.gov.in/PressReleasePage.aspx?PRID=2230621®=3&lang=1 13. Global Innovation Index, https://www.wipo.int/web-publications/global-innovation-index-2025/ en/gii-2025-results.html 14. https://www.pib.gov.in/PressReleasePage.aspx?PRID=2214872®=3&lang=2, https://www. pib.gov.in/PressReleasePage.aspx?PRID=2269286®=48&lang=2 exceeding USD 22.6 billion, generating cumulative production and sales exceeding USD 213.7 billion, driving exports exceeding USD 86.9 billion, and creating over 1.439 million direct and indirect jobs. Incentive disbursement under the scheme has crossed USD 3.0 billion as of the same date12.
India has continued to strengthen its innovation credentials through sustained reform, reflected clearly in the Global Innovation Index 2025. India climbed one place to rank 38th globally among 139 economies, retaining its position as the top ranked country in Central and Southern Asia and as the leading lowermiddle- income economy worldwide. This marks the 15th consecutive year that India has performed as an innovation over performer relative to its income level, a streak shared with only one other country, Vietnam. India's standout strengths lie in ICT services exports, where it ranks 1st globally, alongside strong positions in late-stage venture capital deals (4th), intangible asset intensity (8th), and unicorn valuation (11th), underscoring an increasingly knowledge and technology-driven economy.13
On the startup front, India crossed the milestone of over INR 0.2 million DPIIT-recognized startups as of December 2025, marking a decade since the Startup India initiative launched in 2016 and cementing India's position among the world's largest startup ecosystems. Nearly half of these recognized startups now originate from Tier II and Tier III cities, indicating that entrepreneurship is spreading well beyond India's traditional metro hubs. This growth has been supported by a full lifecycle ecosystem spanning funding, mentorship and scale up, including the Atal Innovation Mission's second phase (AIM 2.0), which focuses on closing ecosystem gaps and scaling proven models in partnership with government, industry, academia and local communities, alongside grassroots and rural entrepreneurship programs such as SVEP, ASPIRE and PMEGP that support micro enterprises, women led ventures and local job creation.14
Real GDP Growth in India: FY 2012-13 to FY 2026-27 P
Foreign Trade
Despite persistent global challenges, total exports (services and goods) in FY 2025-26 exceeded the previous year's record, reaching an estimated USD 860.09 billion, up from USD 825.26 billion in FY 2024-25 (4.22% growth ). Imports for FY 2025-26 are estimated at USD 979.40 billion, up by ~6.47% from USD 919.92 billion in FY 2024-25.
India's service sector saw a strong 7.94% increase in exports, rising from USD 387.55 billion in FY 2024-25 to USD 418.31 billion in FY 2025-26. Imports in this sector also grew by of 2.86%, from USD 198.72 billion in FY 2024-25 to USD 204.42 billion in FY 2025-26, resulting in a trade surplus of USD 213.89 billion for FY 2025-26, up from USD 188.84 billion the previous year.
In the goods sector, exports in FY 2025-26 remained broadly in line with the previous year, growing modestly to USD 441.78 billion compared to USD 437.70 billion in FY 2024-25 (0.93% growth). Imports, however, grew by 7.46%, rising to USD 774.98 billion in FY 2025-26 from USD 721.20 billion in FY 2024-25, widening the merchandise trade deficit to USD 333.19 billion from USD 283.50 billion.15
Key drivers of merchandise export growth in FY 2025–26 included electronic goods, engineering goods, and pharmaceuticals, which continued to benefit from strong global demand and improved manufacturing competitiveness.
Foreign Direct Investment (FDI)
India has emerged as a prime destination for Foreign Direct Investment (FDI) in recent years, driven by various factors that have significantly enhanced its appeal. The UNCTAD World Investment Report 2025 shows India climbing to the 16th most preferred FDI destination with inflows of USD 28 billion. Moreover, India ranks fourth globally for greenfield investment project announcements, with 1,080 projects recorded in 2024, behind only the United States, the United Arab Emirates, and the United Kingdom, and stands fifth globally for international project finance deals, with 97 deals recorded during the year.16
FDI Inflow
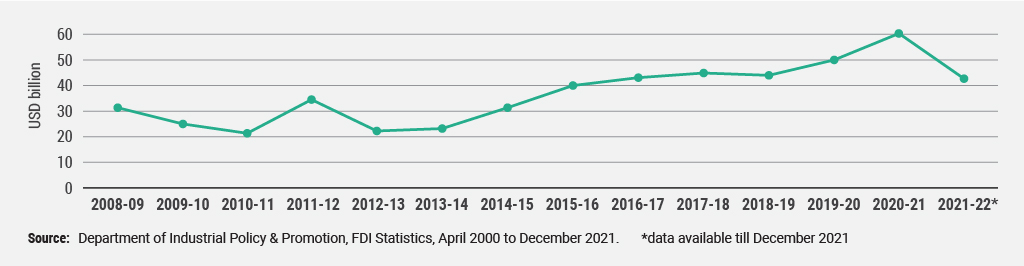
From April 2000 to March 2026, cumulative FDI inflows into India stood at USD 1,166.4 billion, of which cumulative FDI equity inflows amounted to USD 790.6 billion. During FY 2025 to 26, India received USD 94.5 billion in total FDI inflows, including USD 58.8 billion in FDI equity inflows, reflecting sustained investor confidence. Maharashtra, Karnataka, and Gujarat remained the leading FDI destinations.17
Annual FDI Equity Inflows into India: FY 2012-13 to FY 2025-26
Country-Wise FDI Equity Inflows
From April 2000 to March 2026, cumulative FDI equity inflows from Singapore totaled at USD 194.69 billion, making Singapore the largest source of FDI into India. Singapore, Mauritius, and the USA together contributed approximately 59% of India's cumulative FDI equity inflows during the period.
During FY 2025–26 (April–March), Singapore remained the largest source of FDI equity inflows into India with USD 19.80 billion, followed by the United States (USD 11.17 billion), Mauritius (USD 6.58 billion), and Japan (USD 3.75 billion). It is pertinent to note that some of the key countries mentioned here are favorable jurisdictions for investing in India.

Sector-Wise FDI Equity Inflows
From April 2000 to March 2026, the Services Sector attracted the highest cumulative FDI equity inflows into India at USD 128.87 billion, followed closely by Computer Software and Hardware with USD 124.67 billion. Trading ranked third, attracting USD 51.61 billion in cumulative FDI equity inflows.
During FY 2025 to 26, Computer Software and Hardware emerged as the largest recipient of FDI equity inflows, attracting USD 13.95 billion and accounting for 24% of total FDI equity inflows. It was followed by the Services Sector (USD 10.01 billion, 17%), Trading (USD 4.01 billion, 7%), Non-Conventional Energy (USD 3.02 billion, 5%), and Food Processing Industries (USD 3.01 billion, 5%).18

- 7. Sector-wise GVA data, Economic Survey 2023-24, https://www.indiabudget.gov.in/economicsurvey/doc/echapter.pdf
- 8. Ministry of Commerce & Industry, https://pib.gov.in/PressReleasePage.aspx?PRID=2039119
- 9. Global Innovation Index 2024, https://www.wipo.int/web-publications/global-innovation-index-2024/assets/67729/2000%20Global%20Innovation%20Index%202024_WEB3lite.pdf
- 10. PIB – Government of India, https://static.pib.gov.in/WriteReadData/specificdocs/documents/2024/jul/doc2024722351601.pdf
- 11. Vision India @2047, https://pib.gov.in/PressReleasePage.aspx?PRID=1794129
- 12. Ministry of Commerce & Industry, https://pib.gov.in/PressReleseDetailm.aspx?PRID=2017942
- 13. World Investment Report 2023, https://unctad.org/system/files/official-document/wir2023_en.pdf
- 14. Factsheet on FDI inflow, 11 https://www.dpiit.gov.in/static/uploads/2026/06/41192ca92c1de34eb064800fbffa0379